Carbondale: Fire Incidents, Colorado (CO)
Where are fire incidents reported in Carbondale, CO
Something went wrong! Please refresh the page.
|
| |||||||||||||||||||||||||||||||||||||||||||||||||||||||||||||||||||||||||||||||||||||||||||||||||||||||||||||
| Other | 100 | |||||||||||||||||||||||||||||||||||||||||||||||||||||||||||||||||||||||||||||||||||||||||||||||||||||||||||||
2002 - 2018 National Fire Incident Reporting System (NFIRS) incidents
- Incident types reported to NFIRS in Carbondale, CO
- 3,06940.4%Rescue & EMS
- 1,44519.0%Good Intent Call
- 1,06614.0%False Alarm
- 80610.6%Fire
- 79710.5%Hazardous Condition
- 4105.4%Service Call
- Fire incident types reported to NFIRS in Carbondale, CO
- 42652.9%Outside Fires
- 26332.6%Structure Fires
- 9111.3%Mobile Property/Vehicle Fires
- 263.2%Other
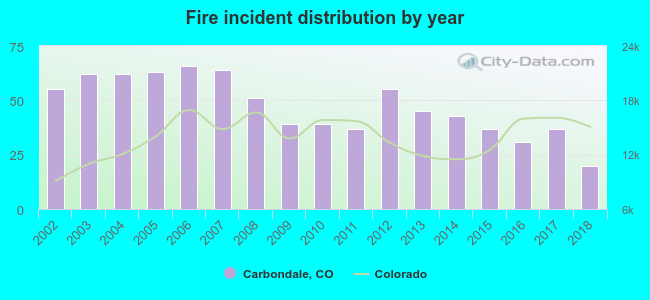 Based on the data from the years 2002 - 2018 the average number of fire incidents per year is 47. The highest number of reported fires - 66 took place in 2006, and the least - 20 in 2018. The data has a decreasing trend.
The average number of yearly fire incidents per 10k residents in Carbondale, CO compared to nearest cities:
(Note: Based on data for the last 3 years, including only cities with population 5,000 and above)
| Carbondale: | 44.6 |
| Glenwood Springs: | 27.4 |
| Gypsum: | 44.6 |
| Aspen: | 23.5 |
| Eagle: | 29.9 |
| Rifle: | 44.3 |
| Edwards: | 19.2 |
| Avon: | 27.4 |
| Vail: | 78.2 |
 The median response time based on all reported fire incidents is 8 minutes. This is higher compared to the state median value.
The median response time in Carbondale, CO compared to nearest cities:
(Note: Based on data for all years, including only cities with at least 500 fire incidents)
| Carbondale: | 8 minutes |
| Glenwood Springs: | 7 minutes |
| Rifle: | 11 minutes |
| Parachute: | 11 minutes |
| Vail: | 6 minutes |
| Hotchkiss: | 10 minutes |
| Breckenridge: | 7 minutes |
| Clifton: | 6 minutes |
| Montrose: | 8 minutes |
 30.0% incidents where reported in the morning and 70.0% in the evening. The most fires (15.3%) took place on Wednesday, and the least (12.7%) on Sunday.
 According to the 806 reports from years 2002 - 2018 most fires (15.3%) took place during April, and the least (4.5%) in October.
 Out of all 7,605 cases reported during the years 2002 - 2018, the most belonged to the categories: Rescue & EMS (40.4%), Good Intent Call (19.0%), and False Alarm (14.0%).
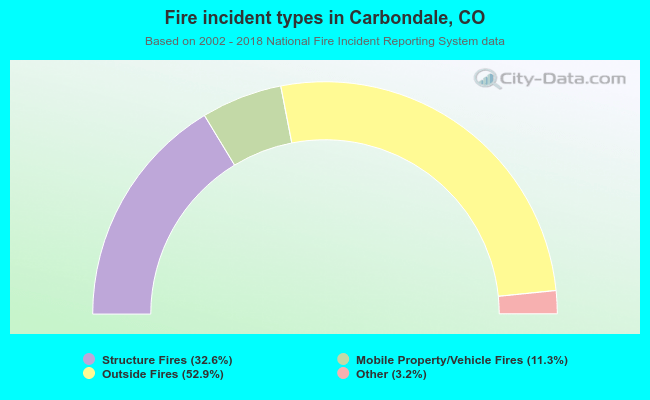 When looking into fire subcategories, the most reports belonged to: Outside Fires (52.9%), and Structure Fires (32.6%).