| Fire incidents reported |
|---|
| Sreet name | Count |
|---|
| WELCOME SLOUGH RD | 28 | | COLUMBIA ST | 20 | | SR4 HWY | 12 | | ELOCHOMIN VALLEY ROAD | 10 | | GREENWOOD RD | 10 | | 3RD | 8 | | BIRNIE SLOUGH RD | 8 | | CEDAR LN | 8 | | ELOCHOMAN VALLEY RD | 8 | | SR 4 | 8 | | SR 4 HWY | 8 | | FERN HILL RD | 6 | | LITTLE ISLAND RD | 6 | | MAIN ST | 6 | | MORGAN DR | 6 | | OCEAN BEACH HIGHWAY HWY | 6 | | SUNNYSANDS RD | 6 | | BEAVER CREEK RD | 4 | | CLOVER STREET | 4 | | COLUMBIA STREET | 4 | | EAST STATE ROUTE 4 | 4 | | JACOBSEN RD | 4 | | JACOBSON RD | 4 | | JACOBSON ROAD | 4 | | MUNSON WAY | 4 |
| | | Fire incidents reported |
|---|
| Sreet name | Count |
|---|
| OSTERVOLD RD | 4 | | SR 409 | 4 | | STATE HWY 409 HWY | 4 | | STATE ROUTE 4 HWY | 4 | | STEAMBOAT SLOUGH | 4 | | 3RD ST | 2 | | BEAVER CREEK ROAD | 2 | | BLUE SKY LANE | 2 | | BOEGE RD | 2 | | BUTLER ST | 2 | | CAPEHORN RD | 2 | | CHESTER AVE | 2 | | CHESTER ST | 2 | | COMERCIAL ST | 2 | | COUNTRY COURT LN | 2 | | DEEP RIVER RD | 2 | | ELOCHOMAN RD | 2 | | FERN HILL RD. | 2 | | FERNHILL ROAD | 2 | | GRASSETH DR | 2 | | GREENWOOD ROAD | 2 | | HODGSON RD | 2 | | HOWARD RD | 2 | | IRVING ST | 2 | | |
|
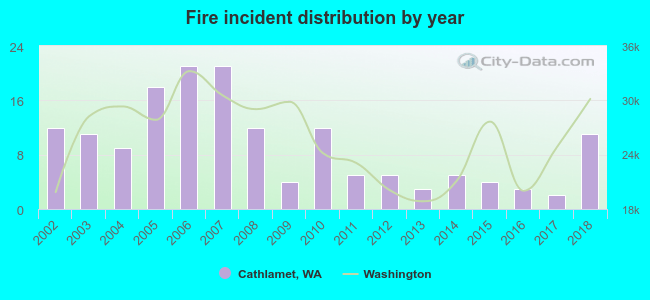 According to the data from the years 2002 - 2018 the average number of fire incidents per year is 9. The highest number of fires - 21 took place in 2006, and the least - 2 in 2017. The data has a dropping trend.
 33.5% incidents where reported in the morning and 66.5% in the evening. The most fires (24.1%) took place on Sunday, and the least (9.5%) on Monday.
 According to the 158 fire incidents from years 2002 - 2018 most fires (13.9%) took place during July, and the least (2.5%) in December.
 Out of all 250 cases reported during the years 2002 - 2018, the most belonged to the categories: Fire (63.2%), Rescue & EMS (10.8%), and Good Intent Call (10.4%).
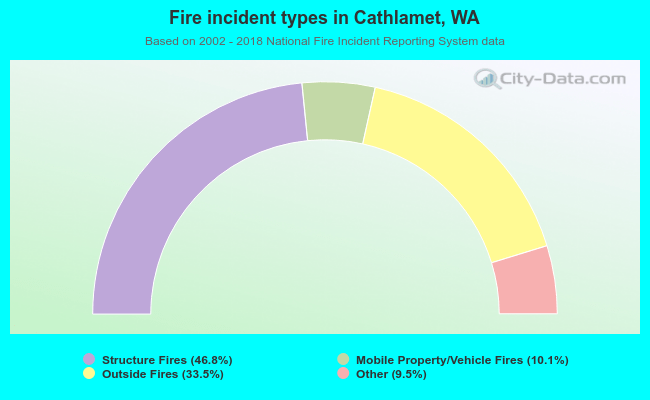 When looking into fire subcategories, the most incidents belonged to: Structure Fires (46.8%), and Outside Fires (33.5%).