Cerritos: Fire Incidents, California (CA)
Where are fire incidents reported in Cerritos, CA
Something went wrong! Please refresh the page.
|
| |||||||||||||||||||||||||||||||||||||||||||||||||||||||||||||||||||||||||||||||||||||||||||||||||||||||||||||
2005 - 2018 National Fire Incident Reporting System (NFIRS) incidents
- Incident types reported to NFIRS in Cerritos, CA
- 11,70267.6%Rescue & EMS
- 2,11012.2%Good Intent Call
- 1,76010.2%False Alarm
- 7974.6%Fire
- 5233.0%Hazardous Condition
- 4042.3%Service Call
- Fire incident types reported to NFIRS in Cerritos, CA
- 28936.3%Outside Fires
- 27434.4%Mobile Property/Vehicle Fires
- 19824.8%Structure Fires
- 364.5%Other
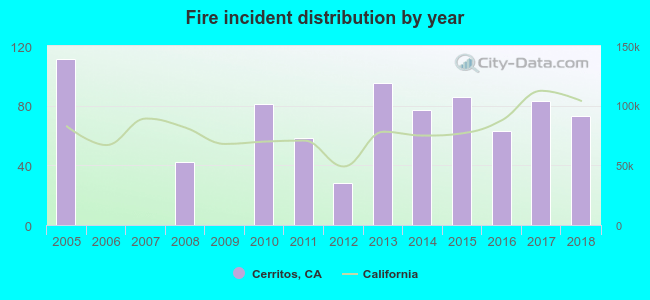 According to the data from the years 2005 - 2018 the average number of fire incidents per year is 57. The highest number of reported fires - 111 took place in 2005, and the least - 0 in 2006. The data has a dropping trend.
The average number of yearly fire incidents per 10k residents in Cerritos, CA compared to nearest cities:
(Note: Based on data for the last 3 years, including only cities with population 5,000 and above)
| Cerritos: | 14.6 |
| Artesia: | 14.4 |
| La Palma: | 7.8 |
| Hawaiian Gardens: | 20.8 |
| Norwalk: | 12.2 |
| Lakewood: | 12.0 |
| Bellflower: | 19.1 |
| Buena Park: | 14.2 |
| Cypress: | 8.7 |
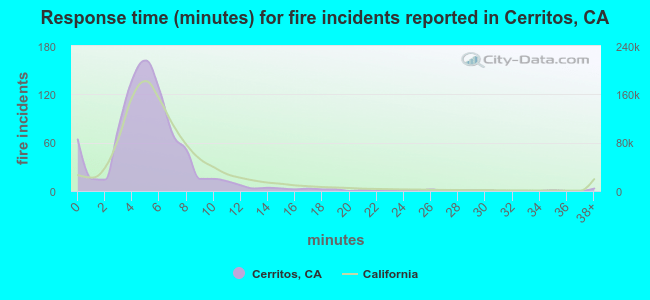 The median response time based on all reported fire incidents is 5 minutes. This is lower compared to the state median value.
The median response time in Cerritos, CA compared to nearest cities:
(Note: Based on data for all years, including only cities with at least 500 fire incidents)
| Cerritos: | 5 minutes |
| Norwalk: | 5 minutes |
| Lakewood: | 4 minutes |
| Bellflower: | 4 minutes |
| Buena Park: | 5 minutes |
| Cypress: | 5 minutes |
| La Mirada: | 5 minutes |
| Santa Fe Springs: | 7 minutes |
| Downey: | 7 minutes |
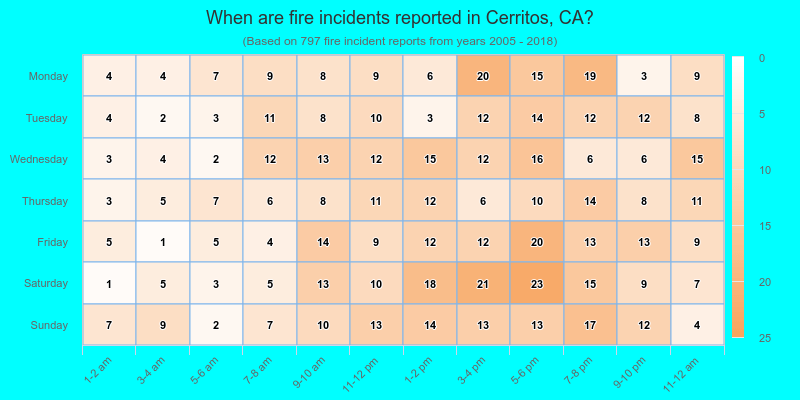
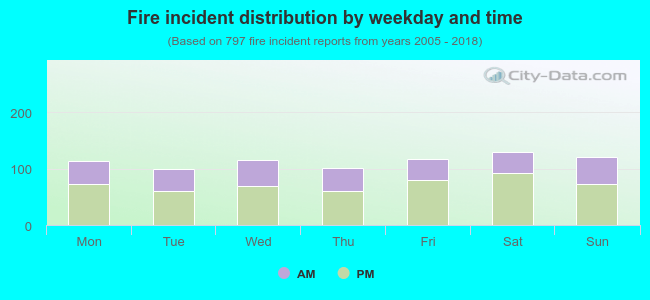 36.1% incidents where reported in the morning and 63.9% in the evening. The most fires (16.3%) took place on Saturday, and the least (12.4%) on Tuesday.
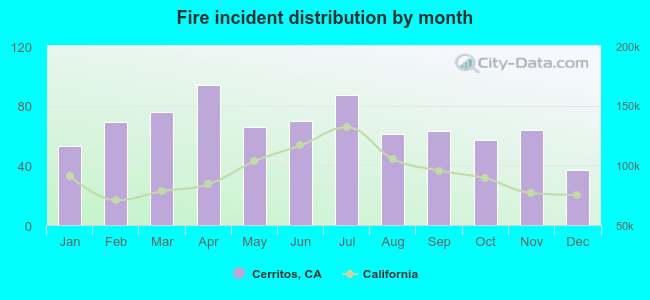 According to the 797 fire incident reports from years 2005 - 2018 most fires (11.8%) took place during April, and the least (4.6%) in December.
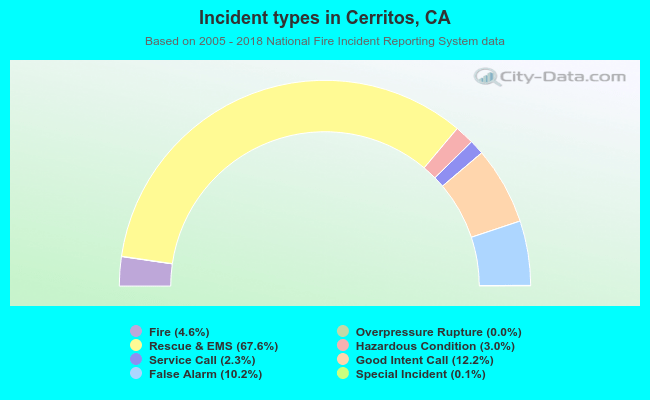 Out of all 17,314 cases reported during the years 2005 - 2018, the most belonged to the categories: Rescue & EMS (67.6%), Good Intent Call (12.2%), and False Alarm (10.2%).
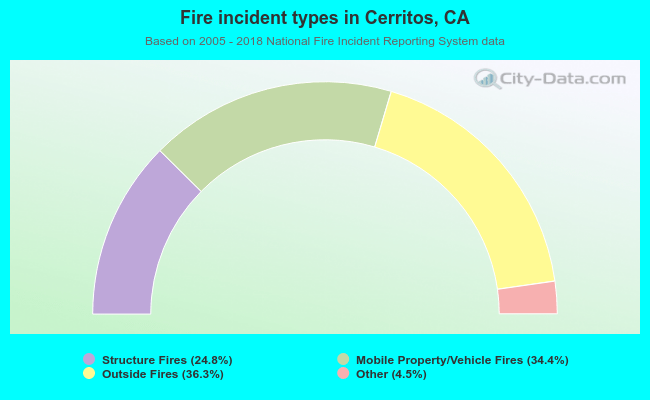 When looking into fire subcategories, the most incidents belonged to: Outside Fires (36.3%), and Mobile Property/Vehicle Fires (34.4%).