| Fire incidents reported |
|---|
| Sreet name | Count |
|---|
| SHEEP MOUNTAIN ROAD | 18 | | INTERSTATE 15 | 8 | | LUMP GULCH | 8 | | CLANCY CREEK | 6 | | HIGHWAY 282 | 6 | | LITTLE BUFFALO GULCH | 6 | | LUMP GULCH ROAD | 6 | | OHIO GULCH | 6 | | 70 HANGING TREE GULCH | 4 | | CORRAL GULCH RD | 4 | | DAHL RANCH ROAD | 4 | | INTERSTATE15 NORTHBOUND | 4 | | RAILROAD WAY | 4 | | SHEEP MOUNTAIN | 4 | | OHIO GULCH | 2 | | #6 ANTELOPE WAY | 2 | | 10 SHADY LANE | 2 | | 15 CLANCY CREEK ROAD | 2 | | 155 N TRAVIS CREEK ROAD | 2 | | 155 NORTH TRAVIS CREEK | 2 | | 160 ELK TRAIL | 2 | | 17 BEAR PAW | 2 | | 17 RIM ROCK | 2 | | 18 RAM ROCK | 2 | | 19 ROCKY ROAD (BLUE SKY HTS) | 2 |
| | | Fire incidents reported |
|---|
| Sreet name | Count |
|---|
| 24 HIDDEN VALLEY DRIVE | 2 | | 24 KARLY DRIVE | 2 | | 25 BULL GULCH | 2 | | 29 HIDDEN VALLEY LOOP | 2 | | 3 GRIZZLY WAY | 2 | | 3 OVERLOOK DRIVE | 2 | | 30 MOUNTAIN MEADOW | 2 | | 310 LUMP GULCH ROAD | 2 | | 314 N. TRAVIS CREEK | 2 | | 314 TRAVIS CREEK ROAD | 2 | | 338 HWY 282 | 2 | | 34 HALFORD LANE | 2 | | 340 HWY 282 | 2 | | 36 MOUNTAIN VIEW | 2 | | 360 CLANCY CREEK ROAD | 2 | | 360 HWY. 282 | 2 | | 37 CHOKECHERRY LANE | 2 | | 4 GREENWOOD TRAIL | 2 | | 4 VIRGINIA CITY ROAD | 2 | | 400 LUMP GULCH ROAD | 2 | | 41 AMBUSH RIDGE | 2 | | 41 SPRUCE STREET | 2 | | 424 LUMP GULCH ROAD | 2 | | 430 LUMP GULCH ROAD | 2 | | |
|
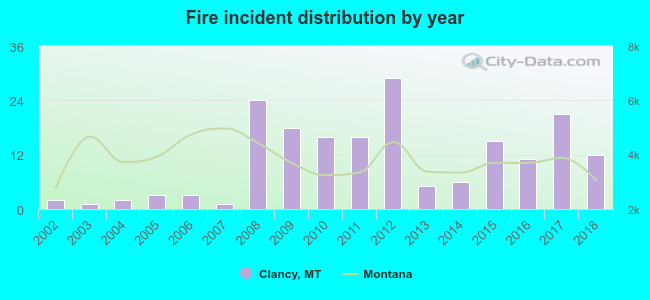 Based on the data from the years 2002 - 2018 the average number of fires per year is 11. The highest number of fires - 29 took place in 2012, and the least - 1 in 2003. The data has a growing trend.
 27.0% incidents where reported in the morning and 73.0% in the evening. The most fires (18.4%) took place on Saturday, and the least (11.9%) on Tuesday.
 According to the 185 incident reports from years 2002 - 2018 most fires (17.8%) took place during August, and the least (2.7%) in February.
 Out of all 398 cases reported during the years 2002 - 2018, the most belonged to the categories: Fire (46.5%), Rescue & EMS (30.4%), and Service Call (16.3%).
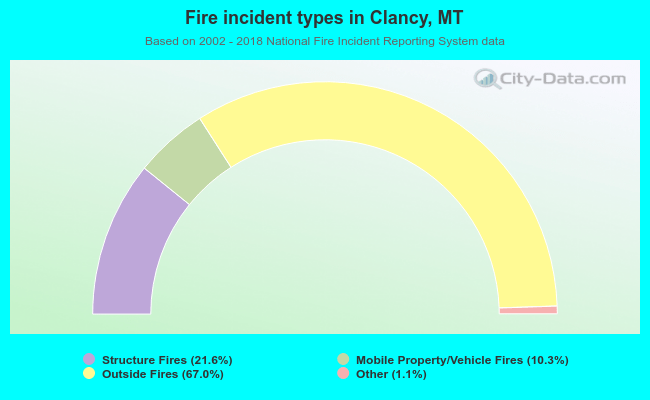 When looking into fire subcategories, the most incidents belonged to: Outside Fires (67.0%), and Structure Fires (21.6%).