Claremont: Fire Incidents, California (CA)
Where are fire incidents reported in Claremont, CA
Something went wrong! Please refresh the page.
|
| |||||||||||||||||||||||||||||||||||||||||||||||||||||||||||||||||||||||||||||||||||||||||||||||||||||||||||||
2005 - 2018 National Fire Incident Reporting System (NFIRS) incidents
- Incident types reported to NFIRS in Claremont, CA
- 11,09066.0%Rescue & EMS
- 3,07218.3%Good Intent Call
- 7684.6%False Alarm
- 7574.5%Service Call
- 6363.8%Fire
- 4462.7%Hazardous Condition
- 220.1%Overpressure Rupture
- Fire incident types reported to NFIRS in Claremont, CA
- 25439.9%Outside Fires
- 18529.1%Structure Fires
- 14923.4%Mobile Property/Vehicle Fires
- 487.5%Other
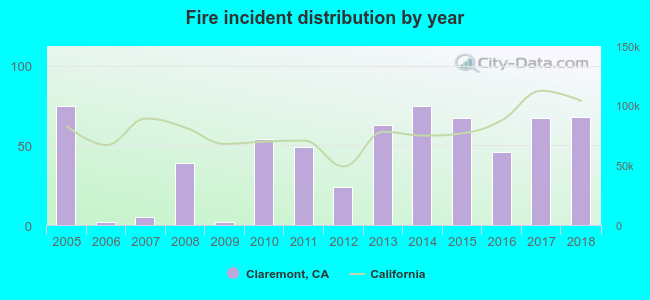 According to the data from the years 2005 - 2018 the average number of fire incidents per year is 45. The highest number of reported fire incidents - 75 took place in 2005, and the least - 2 in 2006. The data has a declining trend.
The average number of yearly fire incidents per 10k residents in Claremont, CA compared to nearest cities:
(Note: Based on data for the last 3 years, including only cities with population 5,000 and above)
| Claremont: | 16.7 |
| La Verne: | 17.0 |
| Montclair: | 3.8 |
| Upland: | 6.6 |
| Pomona: | 27.8 |
| San Dimas: | 14.6 |
| Ontario: | 9.3 |
| Chino: | 11.2 |
| Glendora: | 14.1 |
 The median response time based on all reported fire incidents is 5 minutes. This is lower than the state median value.
The median response time in Claremont, CA compared to nearest cities:
(Note: Based on data for all years, including only cities with at least 500 fire incidents)
| Claremont: | 5 minutes |
| La Verne: | 5 minutes |
| Montclair: | 6 minutes |
| Pomona: | 5 minutes |
| San Dimas: | 5 minutes |
| Ontario: | 6 minutes |
| Chino: | 6 minutes |
| Glendora: | 5 minutes |
| Rancho Cucamonga: | 7 minutes |
 28.5% incidents where reported in the morning and 71.5% in the evening. The most fires (17.1%) took place on Monday, and the least (10.1%) on Tuesday.
 According to the 636 fire incidents from years 2005 - 2018 most fires (12.7%) took place during June, and the least (5.5%) in March.
 Out of all 16,806 cases reported during the years 2005 - 2018, the most belonged to the categories: Rescue & EMS (66.0%), Good Intent Call (18.3%), and False Alarm (4.6%).
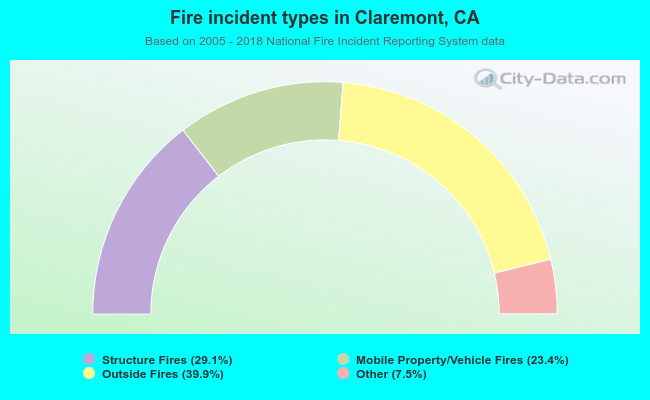 When looking into fire subcategories, the most reports belonged to: Outside Fires (39.9%), and Structure Fires (29.1%).