Cookville: Fire Incidents, Texas (TX)
Where are fire incidents reported in Cookville, TX
Something went wrong! Please refresh the page.
|
| |||||||||||||||||||||||||||||||||||||||||||||||||||||||||||||||||||||||||||||||||||||||||||||||||||||||||||||
| Other | 63 | |||||||||||||||||||||||||||||||||||||||||||||||||||||||||||||||||||||||||||||||||||||||||||||||||||||||||||||
2003 - 2018 National Fire Incident Reporting System (NFIRS) incidents
- Incident types reported to NFIRS in Cookville, TX
- 34764.9%Fire
- 6412.0%Rescue & EMS
- 6011.2%Good Intent Call
- 499.2%Hazardous Condition
- 61.1%Service Call
- 61.1%Severe Weather
- 20.4%False Alarm
- 10.2%Overpressure Rupture
- Fire incident types reported to NFIRS in Cookville, TX
- 22564.8%Outside Fires
- 7722.2%Structure Fires
- 3811.0%Mobile Property/Vehicle Fires
- 72.0%Other
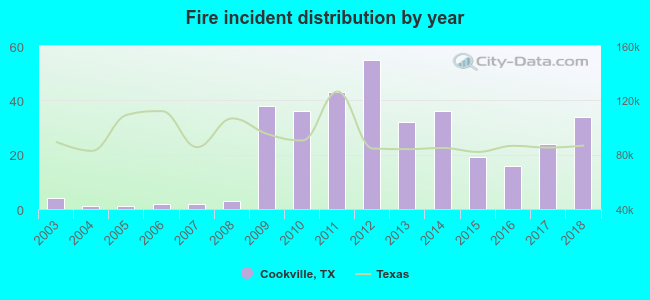 Based on the data from the years 2003 - 2018 the average number of fire incidents per year is 22. The highest number of fires - 55 took place in 2012, and the least - 1 in 2004. The data has a rising trend.
 24.2% incidents where reported in the morning and 75.8% in the evening. The most fires (17.0%) took place on Saturday, and the least (12.7%) on Monday.
 Based on the 347 fire incidents from years 2003 - 2018 most fires (14.1%) took place during March, and the least (4.6%) in May.
 Out of all 535 cases reported during the years 2003 - 2018, the most belonged to the categories: Fire (64.9%), Rescue & EMS (12.0%), and Good Intent Call (11.2%).
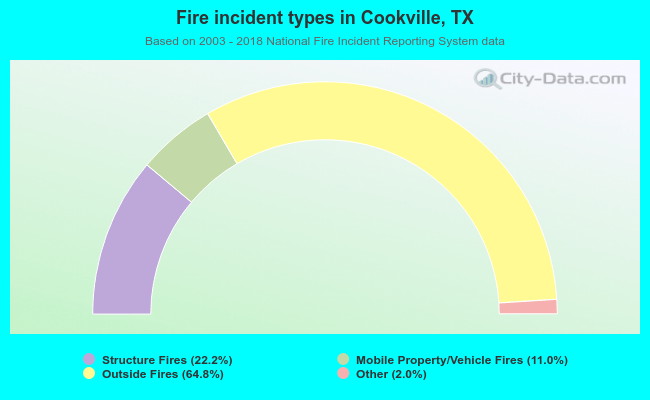 When looking into fire subcategories, the most incidents belonged to: Outside Fires (64.8%), and Structure Fires (22.2%).