Coraopolis: Fire Incidents, Pennsylvania (PA)
Where are fire incidents reported in Coraopolis, PA
Something went wrong! Please refresh the page.
|
| |||||||||||||||||||||||||||||||||||||||||||||||||||||||||||||||||||||||||||||||||||||||||||||||||||||||||||||
2003 - 2018 National Fire Incident Reporting System (NFIRS) incidents
- Incident types reported to NFIRS in Coraopolis, PA
- 24836.6%Fire
- 20930.8%Hazardous Condition
- 7110.5%False Alarm
- 629.1%Good Intent Call
- 558.1%Rescue & EMS
- 304.4%Service Call
- 20.3%Overpressure Rupture
- 10.1%Special Incident
- Fire incident types reported to NFIRS in Coraopolis, PA
- 17068.5%Structure Fires
- 4417.7%Outside Fires
- 2510.1%Mobile Property/Vehicle Fires
- 93.6%Other
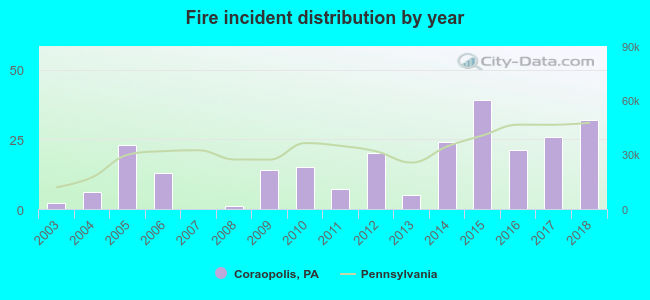 Based on the data from the years 2003 - 2018 the average number of fire incidents per year is 16. The highest number of fires - 39 took place in 2015, and the least - 0 in 2007. The data has a growing trend.
The average number of yearly fire incidents per 10k residents in Coraopolis, PA compared to nearest cities:
(Note: Based on data for the last 3 years, including only cities with population 5,000 and above)
| Coraopolis: | 46.8 |
| Kennedy Township: | 3.5 |
| Robinson Township: | 5.5 |
| Stowe Township: | 3.1 |
| Bellevue: | 45.8 |
| McKees Rocks: | 72.8 |
| Ambridge: | 60.4 |
| Franklin Park: | 0.9 |
| West View: | 31.8 |
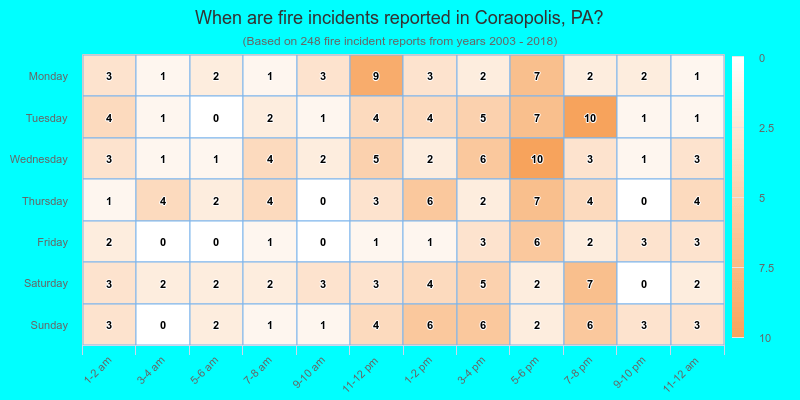
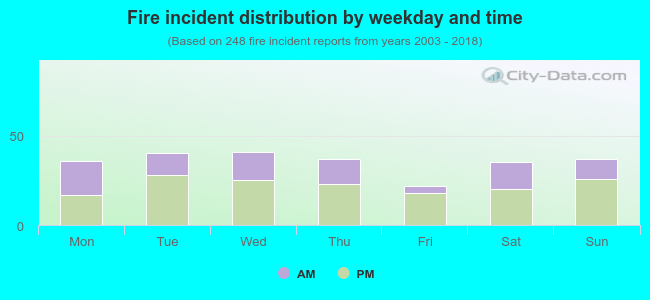 36.7% incidents where reported in the morning and 63.3% in the evening. The most fires (16.5%) took place on Wednesday, and the least (8.9%) on Friday.
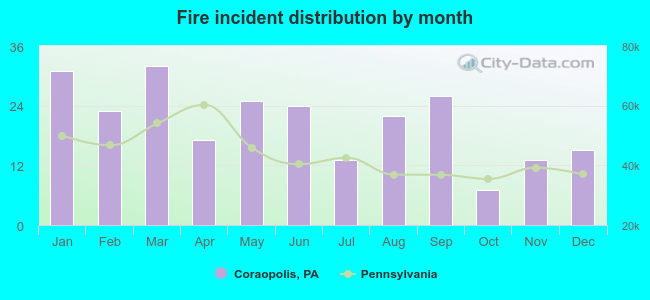 According to the 248 fires from years 2003 - 2018 most fires (12.9%) took place during March, and the least (2.8%) in October.
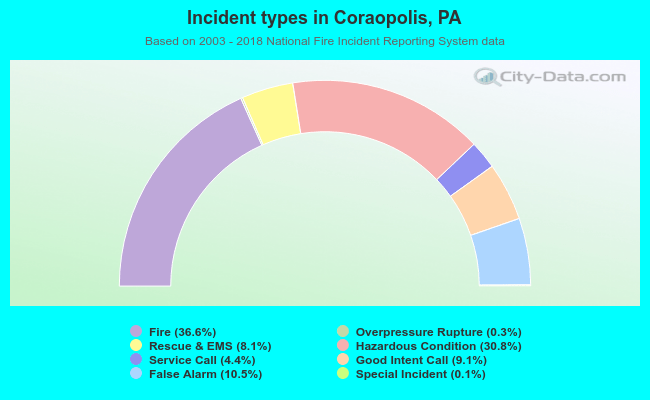 Out of all 678 cases reported during the years 2003 - 2018, the most belonged to the categories: Fire (36.6%), Hazardous Condition (30.8%), and False Alarm (10.5%).
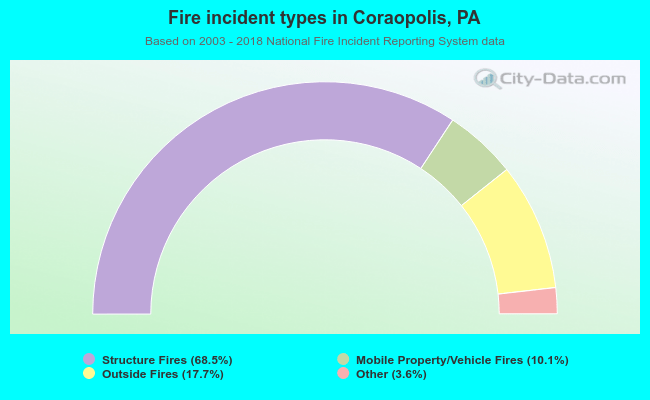 When looking into fire subcategories, the most incidents belonged to: Structure Fires (68.5%), and Outside Fires (17.7%).