Deerfield: Fire Incidents, Massachusetts (MA)
Where are fire incidents reported in Deerfield, MA
Something went wrong! Please refresh the page.
|
| |||||||||||||||||||||||||||||||||||||||||||||||||||||||||||||||||||||||||||||||||||||||||||||||||||||||||||||
2002 - 2018 National Fire Incident Reporting System (NFIRS) incidents
- Incident types reported to NFIRS in Deerfield, MA
- 21330.3%Fire
- 14120.0%False Alarm
- 13819.6%Hazardous Condition
- 11916.9%Rescue & EMS
- 568.0%Good Intent Call
- 273.8%Service Call
- 60.9%Severe Weather
- 40.6%Special Incident
- Fire incident types reported to NFIRS in Deerfield, MA
- 9042.3%Outside Fires
- 8238.5%Structure Fires
- 3114.6%Mobile Property/Vehicle Fires
- 104.7%Other
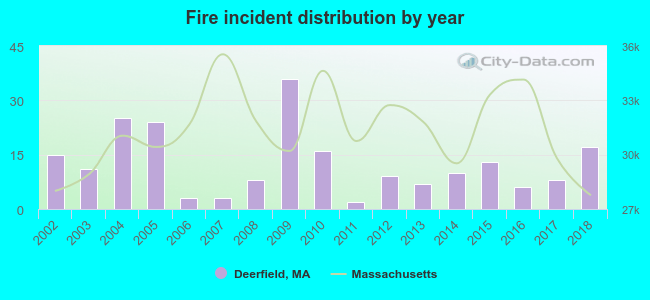 Based on the data from the years 2002 - 2018 the average number of fires per year is 13. The highest number of reported fires - 36 took place in 2009, and the least - 2 in 2011. The data has a rising trend.
The average number of yearly fire incidents per 10k residents in Deerfield, MA compared to nearest cities:
(Note: Based on data for the last 3 years, including only cities with population 5,000 and above)
| Deerfield: | 20.2 |
| Greenfield: | 61.7 |
| Montague: | 5.9 |
| Amherst: | 19.9 |
| Hadley: | 23.5 |
| Northampton: | 16.5 |
| Easthampton: | 27.6 |
| South Hadley: | 42.3 |
| Athol: | 76.2 |

 31.9% incidents where reported in the morning and 68.1% in the evening. The most fires (17.4%) took place on Thursday, and the least (12.2%) on Wednesday.
 Based on the 213 fire incidents from years 2002 - 2018 most fires (31.0%) took place during April, and the least (1.9%) in January.
 Out of all 704 cases reported during the years 2002 - 2018, the most belonged to the categories: Fire (30.3%), Good Intent Call (20.0%), and Rescue & EMS (19.6%).
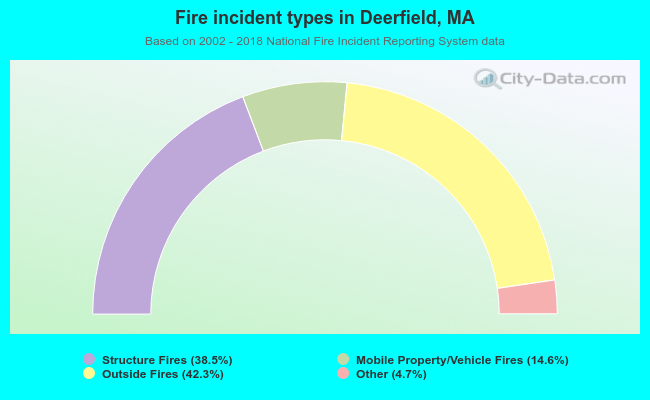 When looking into fire subcategories, the most incidents belonged to: Outside Fires (42.3%), and Structure Fires (38.5%).