Elkins: Fire Incidents, Arkansas (AR)
Where are fire incidents reported in Elkins, AR
Something went wrong! Please refresh the page.
|
| |||||||||||||||||||||||||||||||||||||||||||||||||||||||||||||||||||||||||||||||||||||||||||||||||||||||||||||
2002 - 2018 National Fire Incident Reporting System (NFIRS) incidents
- Incident types reported to NFIRS in Elkins, AR
- 1,04148.6%Rescue & EMS
- 66831.2%Fire
- 22710.6%Good Intent Call
- 823.8%Service Call
- 743.5%Hazardous Condition
- 442.1%False Alarm
- 40.2%Overpressure Rupture
- Fire incident types reported to NFIRS in Elkins, AR
- 31046.4%Outside Fires
- 28642.8%Structure Fires
- 558.2%Mobile Property/Vehicle Fires
- 172.5%Other
 Based on the data from the years 2002 - 2018 the average number of fire incidents per year is 39. The highest number of fire incidents - 62 took place in 2018, and the least - 12 in 2017. The data has a rising trend.
 The median response time based on all reported fire incidents is 8 minutes. This is higher compared to the Arkansas median value.
The median response time in Elkins, AR compared to nearest cities:
(Note: Based on data for all years, including only cities with at least 500 fire incidents)
| Elkins: | 8 minutes |
| Fayetteville: | 5 minutes |
| Farmington: | 6 minutes |
| Springdale: | 5 minutes |
| Prairie Grove: | 9 minutes |
| Huntsville: | 11 minutes |
| Lowell: | 5 minutes |
| Rogers: | 6 minutes |
| Lincoln: | 10 minutes |
 26.0% incidents where reported in the morning and 74.0% in the evening. The most fires (17.2%) took place on Sunday, and the least (10.5%) on Wednesday.
 Based on the 668 incident reports from years 2002 - 2018 most fires (12.9%) took place during January, and the least (3.6%) in October.
 Out of all 2,143 cases reported during the years 2002 - 2018, the most belonged to the categories: Rescue & EMS (48.6%), Fire (31.2%), and Good Intent Call (10.6%).
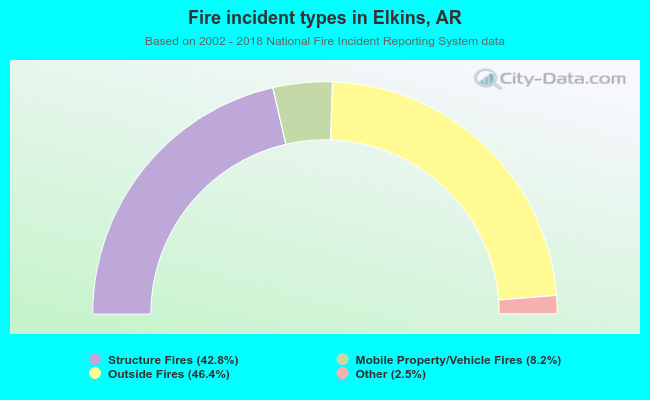 When looking into fire subcategories, the most reports belonged to: Outside Fires (46.4%), and Structure Fires (42.8%).