Enon: Fire Incidents, Ohio (OH)
Where are fire incidents reported in Enon, OH
Something went wrong! Please refresh the page.
|
| |||||||||||||||||||||||||||||||||||||||||||||||||||||||||||||||||||||||||||||||||||||||||||||||||||||||||||||
2002 - 2018 National Fire Incident Reporting System (NFIRS) incidents
- Incident types reported to NFIRS in Enon, OH
- 2,09552.1%Rescue & EMS
- 58914.7%Hazardous Condition
- 42410.5%Fire
- 3919.7%Good Intent Call
- 3829.5%Service Call
- 1162.9%False Alarm
- 150.4%Severe Weather
- Fire incident types reported to NFIRS in Enon, OH
- 17541.3%Structure Fires
- 12629.7%Mobile Property/Vehicle Fires
- 11928.1%Outside Fires
- 40.9%Other
 Based on the data from the years 2002 - 2018 the average number of fires per year is 25. The highest number of reported fires - 60 took place in 2008, and the least - 10 in 2002. The data has a rising trend.
 According to the reports from the years 2002 - 2018 the average number of fire-related casualties per year is 1. The highest number of reported injuries - 4 took place in 2003, and the lowest - 0 in 2002. The data has a growing trend.
 28.3% incidents where reported in the morning and 71.7% in the evening. The most fires (18.4%) took place on Saturday, and the least (12.3%) on Tuesday.
 According to the 424 reports from years 2002 - 2018 most fires (11.6%) took place during March, and the least (5.4%) in September.
 Out of all 4,019 cases reported during the years 2002 - 2018, the most belonged to the categories: Rescue & EMS (52.1%), Hazardous Condition (14.7%), and Fire (10.5%).
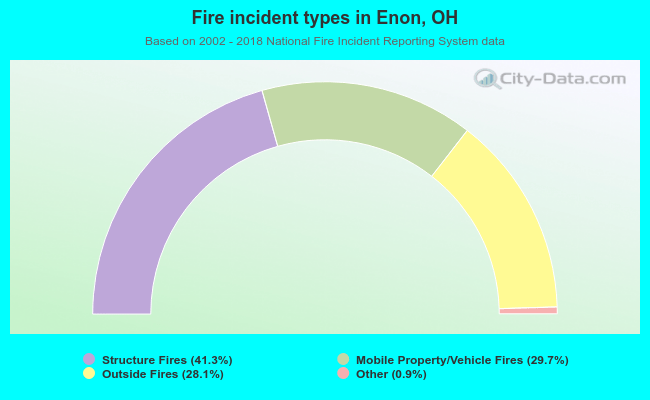 When looking into fire subcategories, the most incidents belonged to: Structure Fires (41.3%), and Mobile Property/Vehicle Fires (29.7%).