| Fire incidents reported |
|---|
| Sreet name | Count |
|---|
| OKALOOSA RD | 62 | | HIGHWAY 34 | 42 | | JACK CROWELL RD | 30 | | CAPLES RD | 16 | | CROWELL RD | 16 | | HWY 546 | 16 | | OLD JONESBORO RD | 16 | | PLUM HILL RD | 14 | | CADEVILLE CUTOFF RD | 12 | | PINE BLUFF RD | 12 | | ANTIOCH CHURCH RD | 10 | | CLARK SPRINGS RD | 10 | | DUKE LN | 10 | | HERMAN DICKERSON RD | 10 | | HIGHWAY 34 HWY | 10 | | SAM HEAD RD | 10 | | CHARLES PERRITT RD | 8 | | CLAYTON DICKERSON RD | 8 | | DEMOSS RD | 8 | | ED FULLER RD | 8 | | HWY 34 | 8 | | JACK BONNETT RD | 8 | | KILPATRICK RD | 8 | | LOTTIE LN | 8 | | M UNDERWOOD RD | 8 |
| | | Fire incidents reported |
|---|
| Sreet name | Count |
|---|
| SULLIVAN RD | 8 | | COONEY BONNETT RD | 6 | | FRANTOM CHAPEL RD | 6 | | GUYTON SWAMP RD | 6 | | HEAD RD | 6 | | HULL GEORGE RD | 6 | | JIM REEVES RD | 6 | | JOE HOLTON RD | 6 | | LA 144 HWY | 6 | | LOTTIE LA | 6 | | SANDY RIDGE RD | 6 | | CADEVILLE LODGE RD | 4 | | DECADE RD | 4 | | ERVIN COTTON RD | 4 | | FOX CAMP RD | 4 | | GEORGE HAMILTON RD | 4 | | JIMMY GRAHAM LOOP | 4 | | LA 144 HIGH | 4 | | LETT LN | 4 | | M BUNN RD | 4 | | MT OLIVE CHURCH RD | 4 | | RAYBURN LOOP | 4 | | SHENANDOAH LN | 4 | | TOM RAWLS RD | 4 | | TREE LN | 4 |
|
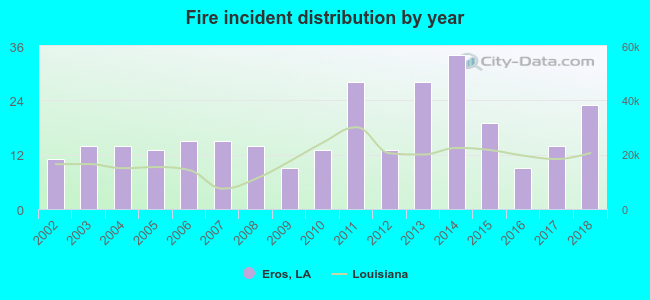 According to the data from the years 2002 - 2018 the average number of fires per year is 17. The highest number of reported fires - 34 took place in 2014, and the least - 9 in 2009. The data has an increasing trend.
 According to the reports from the years 2002 - 2018 the average number of fire-related yearly casualties is 0. The highest number of injuries - 3 took place in 2014, and the lowest - 0 in 2002. The data has a constant trend.
 20.6% incidents where reported in the morning and 79.4% in the evening. The most fires (19.6%) took place on Saturday, and the least (10.8%) on Thursday.
 According to the 286 fires from years 2002 - 2018 most fires (15.4%) took place during March, and the least (2.8%) in November.
 Out of all 978 cases reported during the years 2002 - 2018, the most belonged to the categories: Overpressure Rupture (50.2%), Fire (29.2%), and Service Call (10.2%).
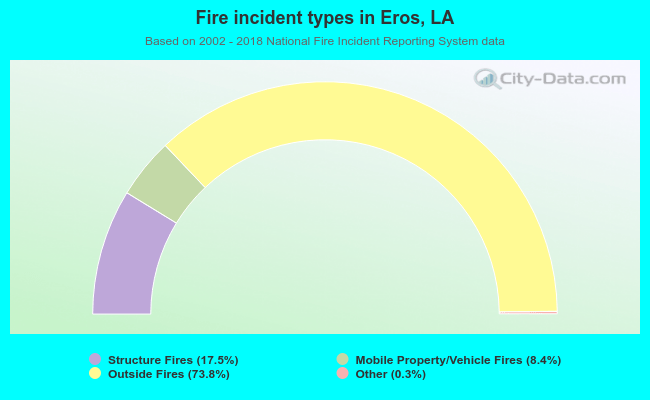 When looking into fire subcategories, the most reports belonged to: Outside Fires (73.8%), and Structure Fires (17.5%).