Fairhaven: Fire Incidents, Massachusetts (MA)
Where are fire incidents reported in Fairhaven, MA
Something went wrong! Please refresh the page.
| Fire incidents reported | |
|---|---|
| Sreet name | Count |
| MAIN ST | 114 |
| HUTTLESTON AVE | 100 |
| FAIRHAVEN COMMONS WAY | 58 |
| SCONTICUT NECK RD | 56 |
| PLAZA WAY | 50 |
| ADAMS ST | 40 |
| ALDEN RD | 38 |
| BRIDGE ST | 32 |
| MILL RD | 32 |
| BERDON WAY | 30 |
| FORT ST | 26 |
| MIDDLE ST | 26 |
| WASHINGTON ST | 24 |
| HOWLAND RD | 22 |
| CENTER ST | 20 |
| MAIN | 20 |
| HUTTLESTON | 18 |
| ADAMS | 16 |
| EBONY ST | 16 |
| FAIRHAVEN COMMONS WAY | 16 |
| ALDEN | 14 |
| NEW BOSTON RD | 14 |
| OCEAN MEADOWS | 14 |
| GREEN ST | 12 |
| HEDGE ST | 12 |
| PLAZA WAY | 12 |
| WATER ST | 12 |
| BAYVIEW AVE | 10 |
| OCEAN AVE | 10 |
| UNION WHARF | 10 |
| Other | 139 |
2002 - 2018 National Fire Incident Reporting System (NFIRS) incidents
- Incident types reported to NFIRS in Fairhaven, MA
- 12,90663.2%Rescue & EMS
- 2,80313.7%Hazardous Condition
- 1,5387.5%False Alarm
- 1,4026.9%Service Call
- 1,0135.0%Fire
- 6893.4%Good Intent Call
- 420.2%Special Incident
- 260.1%Overpressure Rupture
- Fire incident types reported to NFIRS in Fairhaven, MA
- 39939.4%Outside Fires
- 38938.4%Structure Fires
- 15915.7%Mobile Property/Vehicle Fires
- 666.5%Other
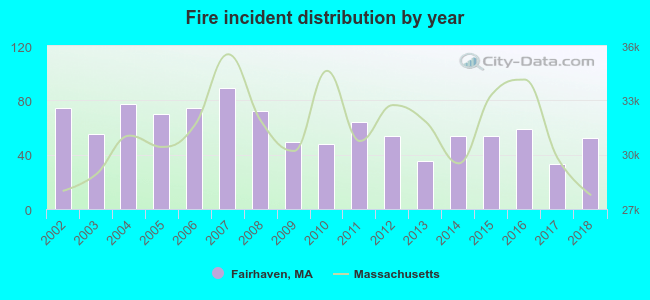 Based on the data from the years 2002 - 2018 the average number of fires per year is 60. The highest number of fires - 89 took place in 2007, and the least - 33 in 2017. The data has a dropping trend.
The average number of yearly fire incidents per 10k residents in Fairhaven, MA compared to nearest cities:
(Note: Based on data for the last 3 years, including only cities with population 5,000 and above)
| Fairhaven: | 30.2 |
| New Bedford: | 46.5 |
| Mattapoisett: | 32.5 |
| Acushnet: | 21.7 |
| Dartmouth: | 22.3 |
| Rochester: | 13.4 |
| Westport: | 41.0 |
| Freetown: | 4.5 |
| Wareham: | 46.6 |
 The median response time based on all reported fire incidents is 3 minutes. This is lower compared to the state median value.
The median response time in Fairhaven, MA compared to nearest cities:
(Note: Based on data for all years, including only cities with at least 500 fire incidents)
| Fairhaven: | 3 minutes |
| New Bedford: | 4 minutes |
| Dartmouth: | 6 minutes |
| Westport: | 5 minutes |
| Wareham: | 6 minutes |
| Onset: | 3 minutes |
| Fall River: | 5 minutes |
| Lakeville: | 6 minutes |
| Falmouth: | 4 minutes |
 Based on the reports from the years 2002 - 2018 the average number of fire-related casualties per year is 2. The highest number of injuries - 6 took place in 2007, and the lowest - 0 in 2002. The data has an increasing trend.
The average number of casualties per 1,000 fire incidents is 25. This indicator was the highest - 74 in 2015, and the lowest 0 in 2002. The trend for injuries per 1,000 fires is growing. Compared to the Massachusetts value the number of injuries per 1,000 incidents is much higher.
Based on the reports from the years 2002 - 2018 the average number of fire-related casualties per year is 2. The highest number of injuries - 6 took place in 2007, and the lowest - 0 in 2002. The data has an increasing trend.
The average number of casualties per 1,000 fire incidents is 25. This indicator was the highest - 74 in 2015, and the lowest 0 in 2002. The trend for injuries per 1,000 fires is growing. Compared to the Massachusetts value the number of injuries per 1,000 incidents is much higher.Casualties per 1,000 incidents in Fairhaven, MA compared to nearest cities:
(Note: Based on data for all years, including only cities with at least 500 fire incidents)
| Fairhaven: | 25.7 |
| New Bedford: | 21.2 |
| Dartmouth: | 5.9 |
| Westport: | 15.5 |
| Wareham: | 25.5 |
| Onset: | 28.4 |
| Fall River: | 26.2 |
| Lakeville: | 0.0 |
| Falmouth: | 38.8 |
 27.8% incidents where reported in the morning and 72.2% in the evening. The most fires (16.0%) took place on Tuesday, and the least (12.6%) on Thursday.
 According to the 1,013 fire incidents from years 2002 - 2018 most fires (12.4%) took place during July, and the least (5.1%) in October.
 Out of all 20,425 cases reported during the years 2002 - 2018, the most belonged to the categories: Rescue & EMS (63.2%), Hazardous Condition (13.7%), and False Alarm (7.5%).
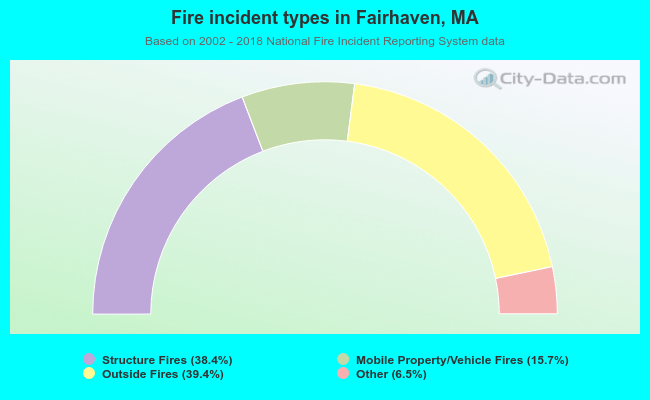 When looking into fire subcategories, the most reports belonged to: Outside Fires (39.4%), and Structure Fires (38.4%).