Federal Way: Fire Incidents, Washington (WA)
Where are fire incidents reported in Federal Way, WA
Something went wrong! Please refresh the page.
| Fire incidents reported | |
|---|---|
| Sreet name | Count |
| PACIFIC HWY | 1,290 |
| 320 ST | 770 |
| CAMPUS DR | 482 |
| MILITARY RD | 280 |
| 23 AVE | 246 |
| 1 AVE | 232 |
| 20 AVE | 214 |
| 336 ST | 200 |
| SB I 5 FWY | 196 |
| 312 ST | 194 |
| STAR LAKE RD | 194 |
| 16 AVE | 184 |
| 18 AVE | 174 |
| 21 AVE | 170 |
| NB I 5 FWY | 166 |
| ENCHANTED PKY | 148 |
| 288 ST | 136 |
| 14 AVE | 126 |
| 324 ST | 118 |
| DASH POINT RD | 116 |
| 28 AVE | 112 |
| 348 ST | 112 |
| 9 AVE | 112 |
| 330 ST | 110 |
| 25 AVE | 108 |
| 314 ST | 108 |
| PACIFIC HY | 108 |
| 8 AVE | 102 |
| 308 ST | 92 |
| 1 WAY | 88 |
2002 - 2018 National Fire Incident Reporting System (NFIRS) incidents
- Incident types reported to NFIRS in Federal Way, WA
- 47,18669.2%Rescue & EMS
- 6,4029.4%Fire
- 4,2886.3%Good Intent Call
- 4,1016.0%False Alarm
- 2,9174.3%Hazardous Condition
- 2,7384.0%Service Call
- 3310.5%Special Incident
- 1060.2%Overpressure Rupture
- 1060.2%Severe Weather
- Fire incident types reported to NFIRS in Federal Way, WA
- 2,80943.9%Outside Fires
- 2,38837.3%Structure Fires
- 1,12617.6%Mobile Property/Vehicle Fires
- 791.2%Other
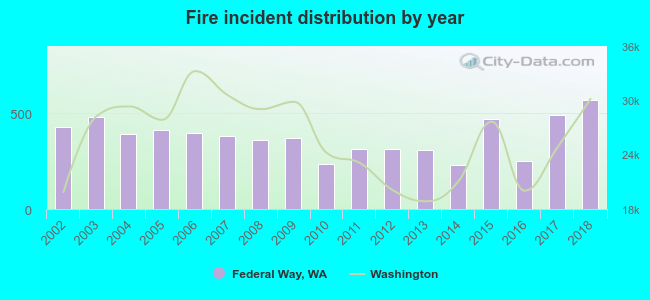 Based on the data from the years 2002 - 2018 the average number of fires per year is 377. The highest number of fires - 567 took place in 2018, and the least - 231 in 2014. The data has an increasing trend.
The average number of yearly fire incidents per 10k residents in Federal Way, WA compared to nearest cities:
(Note: Based on data for the last 3 years, including only cities with population 5,000 and above)
| Federal Way: | 46.6 |
| Milton: | 38.0 |
| Pacific: | 31.1 |
| Fife: | 68.8 |
| Des Moines: | 41.1 |
| Auburn: | 54.1 |
| Edgewood: | 24.6 |
| Kent: | 38.4 |
| Tacoma: | 50.3 |
 The median response time based on all reported fire incidents is 6 minutes. This is about the same as the state median value.
The median response time in Federal Way, WA compared to nearest cities:
(Note: Based on data for all years, including only cities with at least 500 fire incidents)
| Federal Way: | 6 minutes |
| Milton: | 7 minutes |
| Fife: | 5 minutes |
| Des Moines: | 5 minutes |
| Auburn: | 6 minutes |
| Edgewood: | 7 minutes |
| Kent: | 6 minutes |
| Tacoma: | 5 minutes |
| Sumner: | 8 minutes |
 According to the reports from the years 2002 - 2018 the average number of fire-related yearly deaths is 1. The highest number of deaths - 6 took place in 2012, and the lowest - 0 in 2002. The data has a constant trend.
The average number of deaths per 1,000 fire incidents is 2. This indicator was the highest - 19 in 2012, and the lowest 0 in 2002. The trend for deaths per 1,000 incidents is decreasing. Compared to the state value the number of deaths per 1,000 incidents is higher.
According to the reports from the years 2002 - 2018 the average number of fire-related yearly deaths is 1. The highest number of deaths - 6 took place in 2012, and the lowest - 0 in 2002. The data has a constant trend.
The average number of deaths per 1,000 fire incidents is 2. This indicator was the highest - 19 in 2012, and the lowest 0 in 2002. The trend for deaths per 1,000 incidents is decreasing. Compared to the state value the number of deaths per 1,000 incidents is higher.
 According to the data from the years 2002 - 2018 the average number of fire-related yearly casualties is 8. The highest number of reported casualties - 14 took place in 2008, and the lowest - 2 in 2002. The data has a rising trend.
The average number of injuries per 1,000 fire incidents is 23. This indicator was the highest - 51 in 2010, and the lowest 4 in 2003. The trend for injuries per 1,000 incidents is rising. Compared to the state value the number of injuries per 1,000 fire incidents is much higher.
According to the data from the years 2002 - 2018 the average number of fire-related yearly casualties is 8. The highest number of reported casualties - 14 took place in 2008, and the lowest - 2 in 2002. The data has a rising trend.
The average number of injuries per 1,000 fire incidents is 23. This indicator was the highest - 51 in 2010, and the lowest 4 in 2003. The trend for injuries per 1,000 incidents is rising. Compared to the state value the number of injuries per 1,000 fire incidents is much higher.
 32.7% incidents where reported in the morning and 67.3% in the evening. The most fires (14.7%) took place on Sunday, and the least (14.0%) on Tuesday.
 According to the 6,402 fires from years 2002 - 2018 most fires (17.7%) took place during July, and the least (4.5%) in February.
 Out of all 68,175 cases reported during the years 2002 - 2018, the most belonged to the categories: Rescue & EMS (69.2%), Fire (9.4%), and Good Intent Call (6.3%).
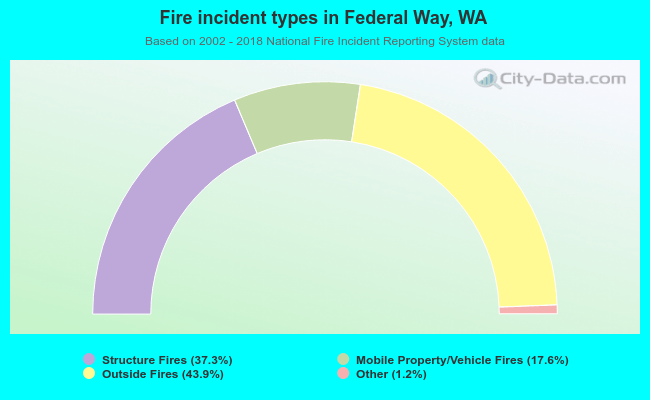 When looking into fire subcategories, the most incidents belonged to: Outside Fires (43.9%), and Structure Fires (37.3%).