Fowler: Fire Incidents, California (CA)
Where are fire incidents reported in Fowler, CA
Something went wrong! Please refresh the page.
|
| |||||||||||||||||||||||||||||||||||||||||||||||||||||||||||||||||||||||||||||||||||||||||||||||||||||||||||||
2005 - 2018 National Fire Incident Reporting System (NFIRS) incidents
- Incident types reported to NFIRS in Fowler, CA
- 91654.0%Rescue & EMS
- 37221.9%Fire
- 33419.7%Good Intent Call
- 331.9%False Alarm
- 231.4%Hazardous Condition
- 150.9%Service Call
- 30.2%Overpressure Rupture
- Fire incident types reported to NFIRS in Fowler, CA
- 17547.0%Outside Fires
- 12934.7%Mobile Property/Vehicle Fires
- 5314.2%Structure Fires
- 154.0%Other
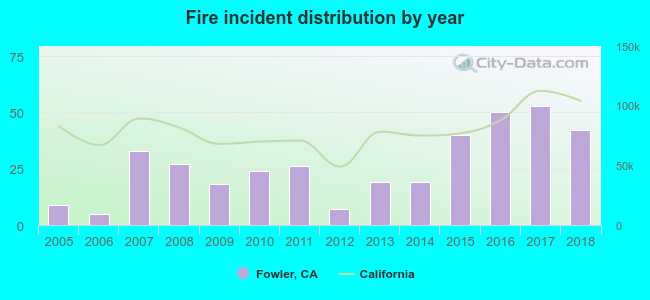 According to the data from the years 2005 - 2018 the average number of fires per year is 27. The highest number of fires - 53 took place in 2017, and the least - 5 in 2006. The data has a rising trend.
The average number of yearly fire incidents per 10k residents in Fowler, CA compared to nearest cities:
(Note: Based on data for the last 3 years, including only cities with population 5,000 and above)
| Fowler: | 80.0 |
| Selma: | 122.0 |
| Parlier: | 45.4 |
| Sanger: | 67.4 |
| Kingsburg: | 79.8 |
| Fresno: | 73.2 |
| Reedley: | 26.7 |
| Clovis: | 32.3 |
| Dinuba: | 52.3 |
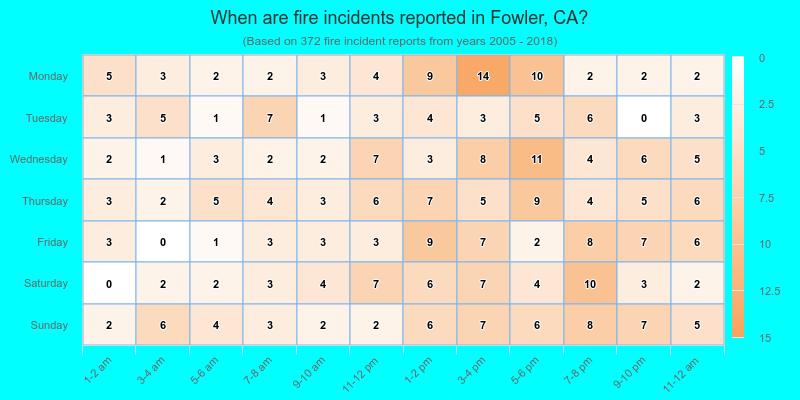
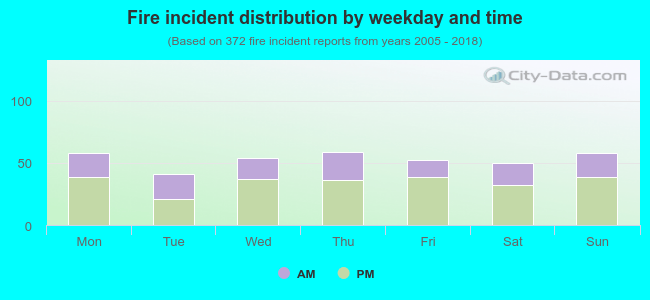 34.7% incidents where reported in the morning and 65.3% in the evening. The most fires (15.9%) took place on Thursday, and the least (11.0%) on Tuesday.
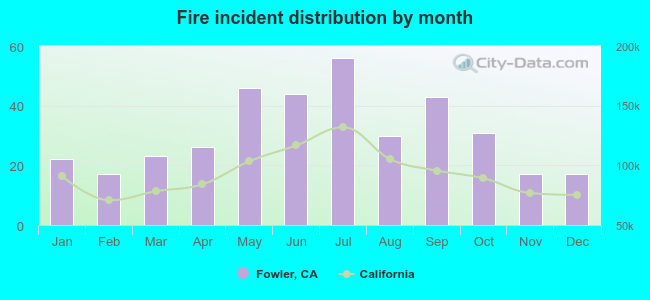 Based on the 372 fires from years 2005 - 2018 most fires (15.1%) took place during July, and the least (4.6%) in February.
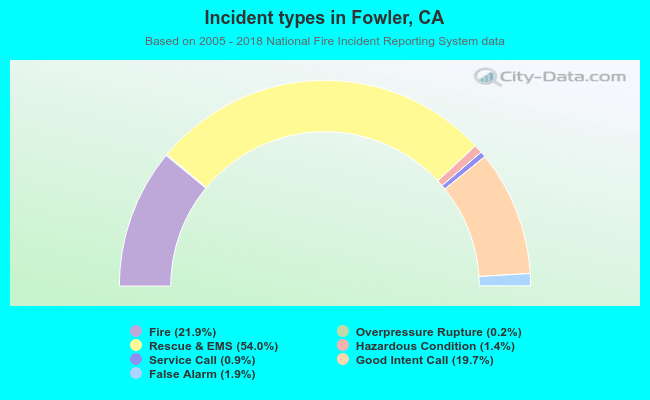 Out of all 1,696 cases reported during the years 2005 - 2018, the most belonged to the categories: Rescue & EMS (54.0%), Fire (21.9%), and Good Intent Call (19.7%).
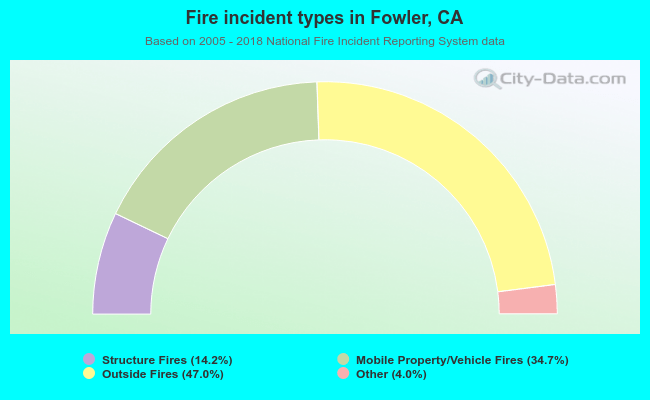 When looking into fire subcategories, the most reports belonged to: Outside Fires (47.0%), and Mobile Property/Vehicle Fires (34.7%).