Frederica: Fire Incidents, Delaware (DE)
Where are fire incidents reported in Frederica, DE
Something went wrong! Please refresh the page.
|
| |||||||||||||||||||||||||||||||||||||||||||||||||||||||||||||||||||||||||||||||||||||||||||||||||||||||||||||
2002 - 2018 National Fire Incident Reporting System (NFIRS) incidents
- Incident types reported to NFIRS in Frederica, DE
- 33027.9%Fire
- 31626.8%Rescue & EMS
- 19516.5%Hazardous Condition
- 14212.0%Service Call
- 11810.0%Good Intent Call
- 625.2%False Alarm
- 90.8%Severe Weather
- 50.4%Special Incident
- 40.3%Overpressure Rupture
- Fire incident types reported to NFIRS in Frederica, DE
- 16148.8%Structure Fires
- 8425.5%Outside Fires
- 4513.6%Mobile Property/Vehicle Fires
- 4012.1%Other
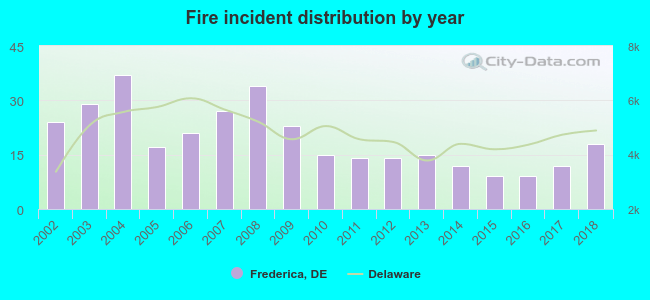 According to the data from the years 2002 - 2018 the average number of fire incidents per year is 19. The highest number of fire incidents - 37 took place in 2004, and the least - 9 in 2015. The data has a dropping trend.
 33.9% incidents where reported in the morning and 66.1% in the evening. The most fires (15.5%) took place on Friday, and the least (10.0%) on Wednesday.
 According to the 330 fires from years 2002 - 2018 most fires (13.6%) took place during March, and the least (4.5%) in November.
 Out of all 1,181 cases reported during the years 2002 - 2018, the most belonged to the categories: Fire (27.9%), Rescue & EMS (26.8%), and Hazardous Condition (16.5%).
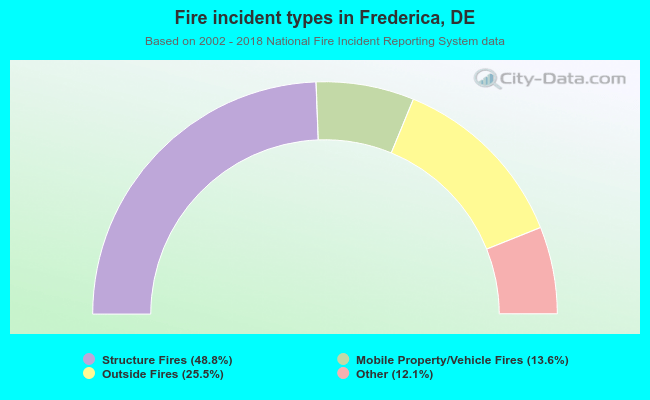 When looking into fire subcategories, the most incidents belonged to: Structure Fires (48.8%), and Outside Fires (25.5%).