Gifford: Fire Incidents, Illinois (IL)
Where are fire incidents reported in Gifford, IL
Something went wrong! Please refresh the page.
|
| |||||||||||||||||||||||||||||||||||||||||||||||||||||||||||||||||||||||||||||||||||||||||||||
2002 - 2018 National Fire Incident Reporting System (NFIRS) incidents
- Incident types reported to NFIRS in Gifford, IL
- 49260.1%Rescue & EMS
- 13816.9%Fire
- 637.7%Hazardous Condition
- 445.4%Good Intent Call
- 404.9%False Alarm
- 384.6%Service Call
- 20.2%Overpressure Rupture
- 10.1%Special Incident
- Fire incident types reported to NFIRS in Gifford, IL
- 6849.3%Outside Fires
- 4532.6%Structure Fires
- 2115.2%Mobile Property/Vehicle Fires
- 42.9%Other
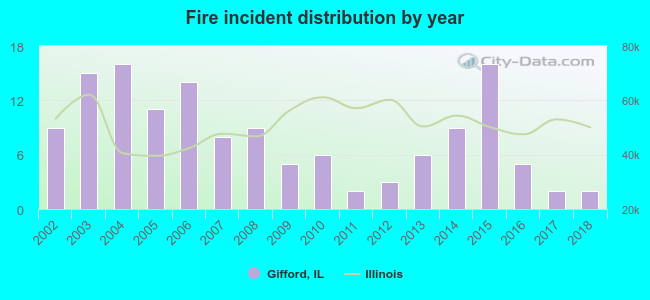 According to the data from the years 2002 - 2018 the average number of fires per year is 8. The highest number of fire incidents - 16 took place in 2004, and the least - 2 in 2011. The data has a decreasing trend.
 29.7% incidents where reported in the morning and 70.3% in the evening. The most fires (18.8%) took place on Monday, and the least (6.5%) on Friday.
 According to the 138 reports from years 2002 - 2018 most fires (18.8%) took place during March, and the least (2.9%) in December.
 Out of all 818 cases reported during the years 2002 - 2018, the most belonged to the categories: Rescue & EMS (60.1%), Fire (16.9%), and Hazardous Condition (7.7%).
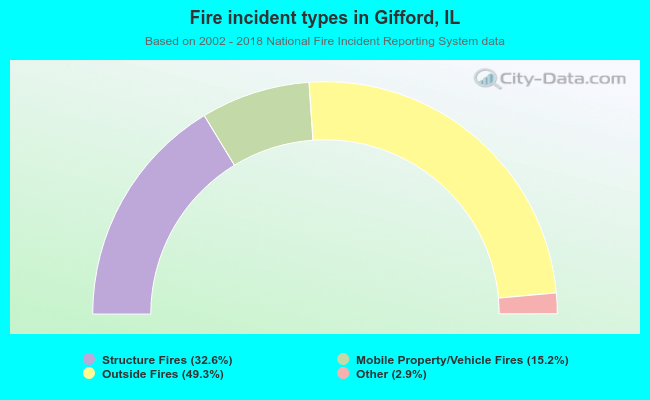 When looking into fire subcategories, the most reports belonged to: Outside Fires (49.3%), and Structure Fires (32.6%).