Glen Rose: Fire Incidents, Texas (TX)
Where are fire incidents reported in Glen Rose, TX
Something went wrong! Please refresh the page.
|
| |||||||||||||||||||||||||||||||||||||||||||||||||||||||||||||||||||||||||||||||||||||||||||||||||||||||||||||
2004 - 2018 National Fire Incident Reporting System (NFIRS) incidents
- Incident types reported to NFIRS in Glen Rose, TX
- 1,62164.5%Rescue & EMS
- 30912.3%Fire
- 2078.2%Service Call
- 1726.8%Good Intent Call
- 1124.5%False Alarm
- 491.9%Hazardous Condition
- 220.9%Special Incident
- 190.8%Overpressure Rupture
- 40.2%Severe Weather
- Fire incident types reported to NFIRS in Glen Rose, TX
- 20365.7%Outside Fires
- 7022.7%Structure Fires
- 278.7%Mobile Property/Vehicle Fires
- 92.9%Other
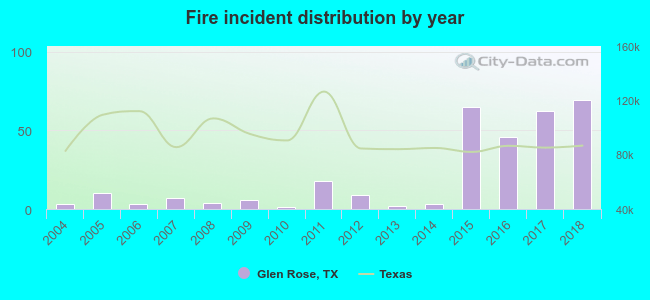 According to the data from the years 2004 - 2018 the average number of fires per year is 21. The highest number of reported fires - 69 took place in 2018, and the least - 1 in 2010. The data has a rising trend.
 25.2% incidents where reported in the morning and 74.8% in the evening. The most fires (19.7%) took place on Tuesday, and the least (9.1%) on Wednesday.
 Based on the 309 fire incidents from years 2004 - 2018 most fires (15.5%) took place during July, and the least (4.2%) in May.
 Out of all 2,515 cases reported during the years 2004 - 2018, the most belonged to the categories: Rescue & EMS (64.5%), Fire (12.3%), and Service Call (8.2%).
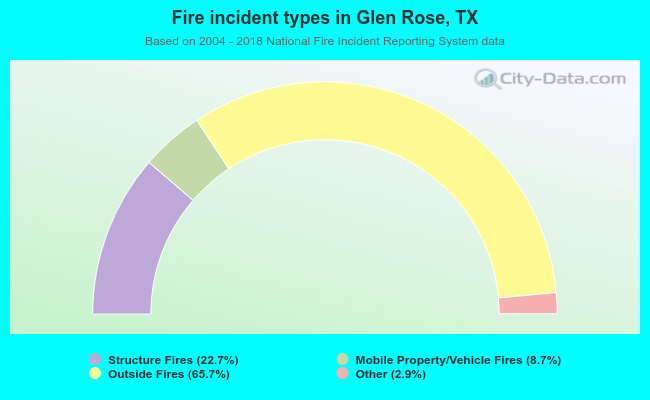 When looking into fire subcategories, the most incidents belonged to: Outside Fires (65.7%), and Structure Fires (22.7%).