Gonzales: Fire Incidents, California (CA)
Where are fire incidents reported in Gonzales, CA
Something went wrong! Please refresh the page.
|
| |||||||||||||||||||||||||||||||||||||||||||||||||||||||||||||||||||||||||||||||||||||||||||||||||||||||||||||
2002 - 2018 National Fire Incident Reporting System (NFIRS) incidents
- Incident types reported to NFIRS in Gonzales, CA
- 17844.1%Fire
- 9523.5%Hazardous Condition
- 7719.1%Good Intent Call
- 4410.9%Rescue & EMS
- 61.5%Service Call
- 41.0%False Alarm
- Fire incident types reported to NFIRS in Gonzales, CA
- 7642.7%Outside Fires
- 6335.4%Structure Fires
- 3318.5%Mobile Property/Vehicle Fires
- 63.4%Other
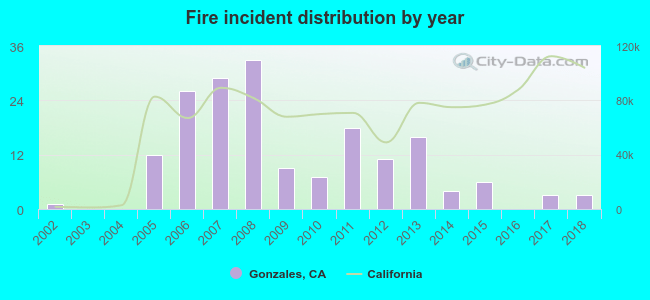 According to the data from the years 2002 - 2018 the average number of fires per year is 10. The highest number of fires - 33 took place in 2008, and the least - 0 in 2003. The data has a rising trend.
The average number of yearly fire incidents per 10k residents in Gonzales, CA compared to nearest cities:
(Note: Based on data for the last 3 years, including only cities with population 5,000 and above)
| Gonzales: | 3.6 |
| Soledad: | 11.7 |
| Carmel Valley: | 19.7 |
| Salinas: | 20.1 |
| Greenfield: | 50.4 |
| Marina: | 29.8 |
| Seaside: | 14.8 |
| Hollister: | 26.9 |
| Prunedale: | 20.7 |

 36.5% incidents where reported in the morning and 63.5% in the evening. The most fires (17.4%) took place on Saturday, and the least (12.4%) on Tuesday.
 According to the 178 fires from years 2002 - 2018 most fires (20.8%) took place during July, and the least (1.7%) in March.
 Out of all 404 cases reported during the years 2002 - 2018, the most belonged to the categories: Fire (44.1%), Rescue & EMS (23.5%), and Service Call (19.1%).
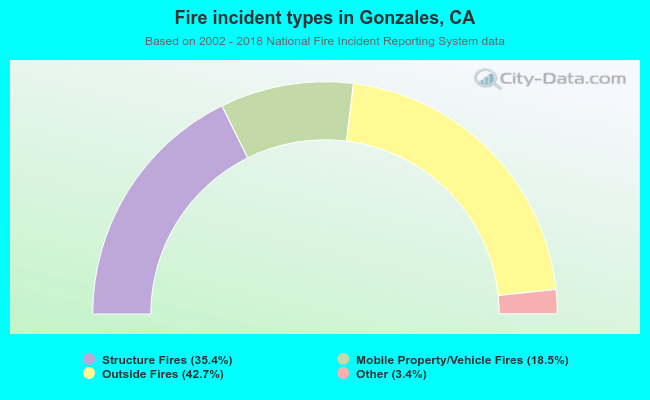 When looking into fire subcategories, the most reports belonged to: Outside Fires (42.7%), and Structure Fires (35.4%).