Great Falls: Fire Incidents, Montana (MT)
Where are fire incidents reported in Great Falls, MT
Something went wrong! Please refresh the page.
| Fire incidents reported | |
|---|---|
| Sreet name | Count |
| 10TH AVE S | 136 |
| 2ND AVE | 130 |
| CENTRAL AVE | 128 |
| 10TH AVE | 126 |
| 5TH AVE | 124 |
| CENTRAL AVE | 122 |
| 6TH AVE | 120 |
| 3RD AVE | 106 |
| 7TH AVE | 100 |
| 4TH AVE | 94 |
| 8TH AVE | 92 |
| 1ST AVE | 88 |
| 1ST AVE N | 88 |
| 2ND AVE N | 86 |
| 2ND AVE S | 68 |
| 3RD AVE N | 58 |
| 4TH AVE N | 58 |
| 9TH AVE | 58 |
| 7TH AVE N | 54 |
| 6TH AVE N | 52 |
| RIVER DR | 52 |
| 3RD AVE S | 50 |
| 5TH AVE S | 50 |
| 9TH ST S | 50 |
| 8TH AVE N | 48 |
| 5TH AVE N | 46 |
| 6TH AVE S | 46 |
| 9TH AVE S | 46 |
| RIVER DR N | 46 |
| 7TH AVE S | 44 |
| Other | 945 |
2002 - 2018 National Fire Incident Reporting System (NFIRS) incidents
- Incident types reported to NFIRS in Great Falls, MT
- 26,04658.6%Rescue & EMS
- 4,54210.2%Service Call
- 4,45410.0%Good Intent Call
- 4,1939.4%Hazardous Condition
- 3,3117.5%Fire
- 1,7884.0%False Alarm
- 480.1%Special Incident
- Fire incident types reported to NFIRS in Great Falls, MT
- 1,55747.0%Outside Fires
- 1,23437.3%Structure Fires
- 47514.3%Mobile Property/Vehicle Fires
- 451.4%Other
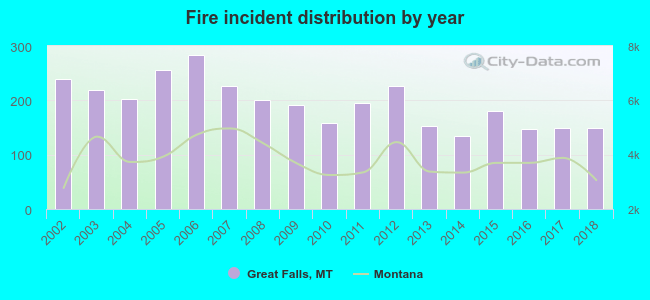 Based on the data from the years 2002 - 2018 the average number of fires per year is 195. The highest number of reported fires - 284 took place in 2006, and the least - 134 in 2014. The data has a decreasing trend.
The average number of yearly fire incidents per 10k residents in Great Falls, MT compared to nearest cities:
(Note: Based on data for the last 3 years, including only cities with population 5,000 and above)
| Great Falls: | 25.2 |
| Helena: | 42.2 |
 The median response time based on all reported fire incidents is 6 minutes. This is lower than the state median value.
The median response time in Great Falls, MT compared to nearest cities:
(Note: Based on data for all years, including only cities with at least 500 fire incidents)
| Great Falls: | 6 minutes |
| Helena: | 8 minutes |
 According to the data from the years 2002 - 2018 the average number of fire-related yearly deaths is 0. The highest number of deaths - 2 took place in 2011, and the lowest - 0 in 2002. The data has an increasing trend.
The average number of fatalities per 1,000 fires is 3. This indicator was the highest - 10 in 2011, and the lowest 0 in 2002. The trend for fatalities per 1,000 fire incidents is growing. Compared to the state value the number of deaths per 1,000 fire incidents is about the same.
According to the data from the years 2002 - 2018 the average number of fire-related yearly deaths is 0. The highest number of deaths - 2 took place in 2011, and the lowest - 0 in 2002. The data has an increasing trend.
The average number of fatalities per 1,000 fires is 3. This indicator was the highest - 10 in 2011, and the lowest 0 in 2002. The trend for fatalities per 1,000 fire incidents is growing. Compared to the state value the number of deaths per 1,000 fire incidents is about the same.Deaths per 1,000 incidents in Great Falls, MT compared to nearest cities:
(Note: Based on data for all years, including only cities with at least 2,500 fire incidents)
| Great Falls: | 2.4 |
 According to the reports from the years 2002 - 2018 the average number of fire-related casualties per year is 3. The highest number of casualties - 6 took place in 2002, and the lowest - 0 in 2006. The data has a declining trend.
The average number of injuries per 1,000 fire incidents is 15. This indicator was the highest - 38 in 2010, and the lowest 0 in 2006. The trend for injuries per 1,000 fire incidents is growing. Compared to the state value the number of casualties per 1,000 fire incidents is much higher.
According to the reports from the years 2002 - 2018 the average number of fire-related casualties per year is 3. The highest number of casualties - 6 took place in 2002, and the lowest - 0 in 2006. The data has a declining trend.
The average number of injuries per 1,000 fire incidents is 15. This indicator was the highest - 38 in 2010, and the lowest 0 in 2006. The trend for injuries per 1,000 fire incidents is growing. Compared to the state value the number of casualties per 1,000 fire incidents is much higher.Casualties per 1,000 incidents in Great Falls, MT compared to nearest cities:
(Note: Based on data for all years, including only cities with at least 500 fire incidents)
| Great Falls: | 15.1 |
| Helena: | 3.6 |
 31.8% incidents where reported in the morning and 68.2% in the evening. The most fires (16.2%) took place on Saturday, and the least (12.1%) on Thursday.
 According to the 3,311 fire incident reports from years 2002 - 2018 most fires (18.3%) took place during July, and the least (6.2%) in October.
 Out of all 44,429 cases reported during the years 2002 - 2018, the most belonged to the categories: Rescue & EMS (58.6%), Service Call (10.2%), and Good Intent Call (10.0%).
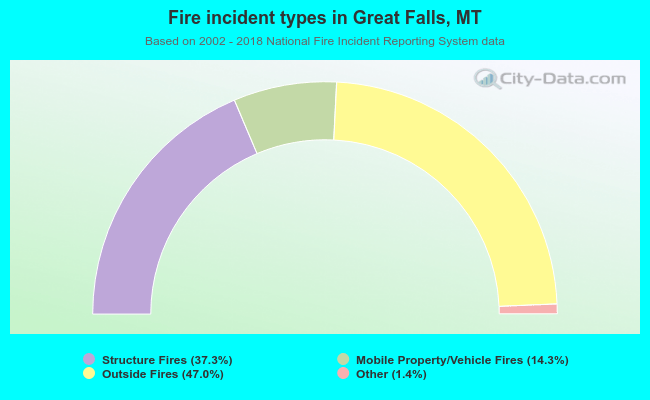 When looking into fire subcategories, the most reports belonged to: Outside Fires (47.0%), and Structure Fires (37.3%).