| Fire incidents reported |
|---|
| Sreet name | Count |
|---|
| 30TH RD | 10 | | 27TH RD | 8 | | 23RD RD | 6 | | LASITA RD | 6 | | PLEASANT HILL RD | 6 | | 10TH RD | 4 | | 17TH RD | 4 | | 2225 22ND RD | 4 | | 2273 30TH RD | 4 | | 28TH AND QUAIL RD | 4 | | FAIRVIEW CHURCH RD | 4 | | FANCY CREEK RD | 4 | | MAY DAY RD | 4 | | OBER RD | 4 | | SEVEN SPRINGS RD | 4 | | STANTON RD | 4 | | VALLEYVIEW RD | 4 | | 1 ST | 2 | | 1001 DIXON ST | 2 | | 103 MARTIN ST | 2 | | 1046 THUNDER RD | 2 | | 11 TH | 2 | | 1108 HIGHLAND ST | 2 | | 1594 THUNDER RD | 2 | | 16520 FANCY CREEK RD | 2 |
| | | Fire incidents reported |
|---|
| Sreet name | Count |
|---|
| 1760 SUNFLOWER RD | 2 | | 19 RD | 2 | | 19 TH VALLEYVIEW | 2 | | 1900 BLK UTAH RD | 2 | | 1945 27TH RD LGTS | 2 | | 1ST AND STOKES | 2 | | 1ST ST | 2 | | 2000 BLK 18TH RD | 2 | | 2000 VALLEYVIEW RD | 2 | | 2036 17TH RD | 2 | | 2100 25TH RD | 2 | | 2100 VALLEYVIEW RD LGTS | 2 | | 2162 30TH RD LGTS | 2 | | 21ST AND THUNDER RD | 2 | | 22 ND UTAH | 2 | | 2200 SUNFLOWER | 2 | | 2227 18TH | 2 | | 2273 30TH RD LGTS | 2 | | 2275 22ND RD | 2 | | 22ND RD | 2 | | 22TH RD | 2 | | 2336 THUNDER RD | 2 | | 23RD AND VALLEYVIEW RD LGTS | 2 | | 24 TH SUNFLOWER | 2 | | 2400 VALLEYVIEW RD LGTS | 2 |
|
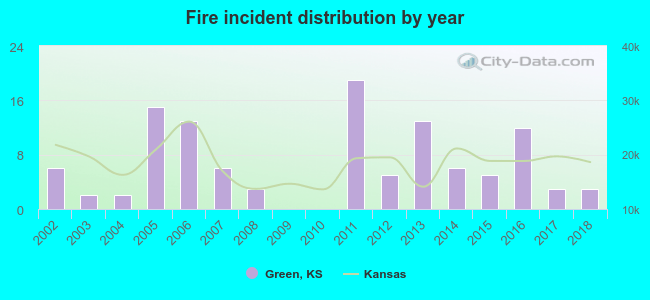 According to the data from the years 2002 - 2018 the average number of fires per year is 7. The highest number of reported fires - 19 took place in 2011, and the least - 0 in 2009. The data has a decreasing trend.
 27.4% incidents where reported in the morning and 72.6% in the evening. The most fires (18.6%) took place on Saturday, and the least (11.5%) on Wednesday.
 According to the 113 reports from years 2002 - 2018 most fires (23.0%) took place during April, and the least (1.8%) in September.
 Out of all 120 cases reported during the years 2002 - 2018, the most belonged to the categories: Fire (94.2%), Rescue & EMS (2.5%), and Overpressure Rupture (1.7%).
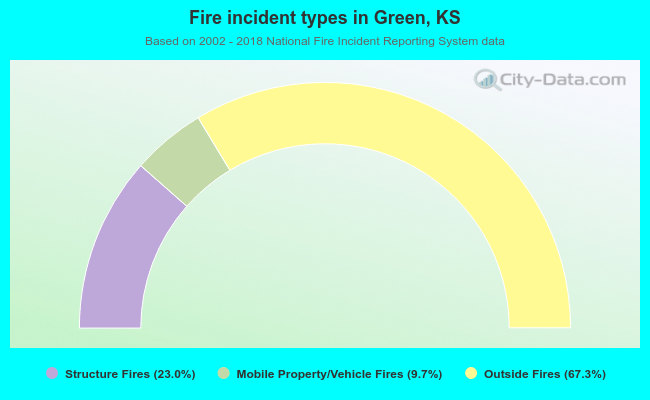 When looking into fire subcategories, the most incidents belonged to: Outside Fires (67.3%), and Structure Fires (23.0%).