Greenwood: Fire Incidents, Missouri (MO)
Where are fire incidents reported in Greenwood, MO
Something went wrong! Please refresh the page.
|
| |||||||||||||||||||||||||||||||||||||||||||||||||||||||||||||||||||||||||||||||||||||||||||||||||||||||||||||
2002 - 2018 National Fire Incident Reporting System (NFIRS) incidents
- Incident types reported to NFIRS in Greenwood, MO
- 85452.5%Rescue & EMS
- 21613.3%Fire
- 17810.9%False Alarm
- 16410.1%Hazardous Condition
- 1257.7%Service Call
- 845.2%Good Intent Call
- 30.2%Overpressure Rupture
- 20.1%Special Incident
- Fire incident types reported to NFIRS in Greenwood, MO
- 11151.4%Outside Fires
- 7735.6%Structure Fires
- 198.8%Mobile Property/Vehicle Fires
- 94.2%Other
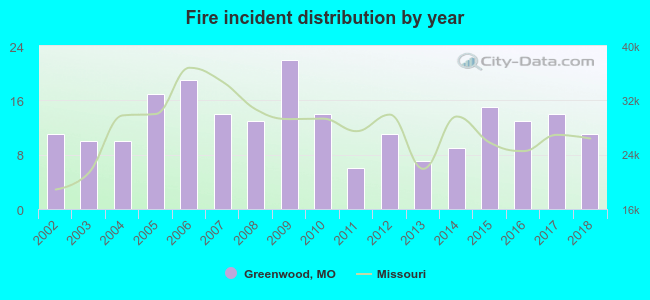 According to the data from the years 2002 - 2018 the average number of fire incidents per year is 13. The highest number of fires - 22 took place in 2009, and the least - 6 in 2011. The data has a constant trend.
The average number of yearly fire incidents per 10k residents in Greenwood, MO compared to nearest cities:
(Note: Based on data for the last 3 years, including only cities with population 5,000 and above)
| Greenwood: | 23.1 |
| Pleasant Hill: | 32.7 |
| Raymore: | 10.5 |
| Grandview: | 44.0 |
| Belton: | 34.0 |
| Raytown: | 6.4 |
| Blue Springs: | 19.5 |
| Grain Valley: | 22.4 |
| Harrisonville: | 7.0 |

 25.5% incidents where reported in the morning and 74.5% in the evening. The most fires (19.4%) took place on Friday, and the least (10.6%) on Wednesday.
 Based on the 216 reports from years 2002 - 2018 most fires (12.5%) took place during July, and the least (5.1%) in December.
 Out of all 1,627 cases reported during the years 2002 - 2018, the most belonged to the categories: Rescue & EMS (52.5%), Fire (13.3%), and False Alarm (10.9%).
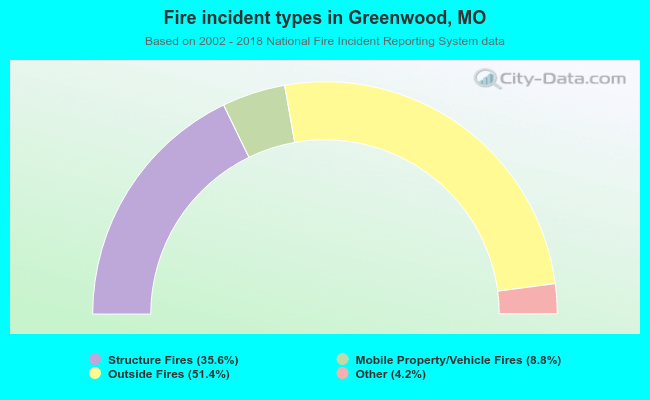 When looking into fire subcategories, the most incidents belonged to: Outside Fires (51.4%), and Structure Fires (35.6%).