Haviland: Fire Incidents, Kansas (KS)
Where are fire incidents reported in Haviland, KS
Something went wrong! Please refresh the page.
|
| |||||||||||||||||||||||||||||||||||||||||||||||||||||||||||||||||
| Other | 61 | |||||||||||||||||||||||||||||||||||||||||||||||||||||||||||||||||
2002 - 2017 National Fire Incident Reporting System (NFIRS) incidents
- Incident types reported to NFIRS in Haviland, KS
- 12344.9%Fire
- 11642.3%Rescue & EMS
- 134.7%Good Intent Call
- 124.4%Hazardous Condition
- 72.6%False Alarm
- 20.7%Service Call
- 10.4%Severe Weather
- Fire incident types reported to NFIRS in Haviland, KS
- 9476.4%Outside Fires
- 129.8%Mobile Property/Vehicle Fires
- 97.3%Other
- 86.5%Structure Fires
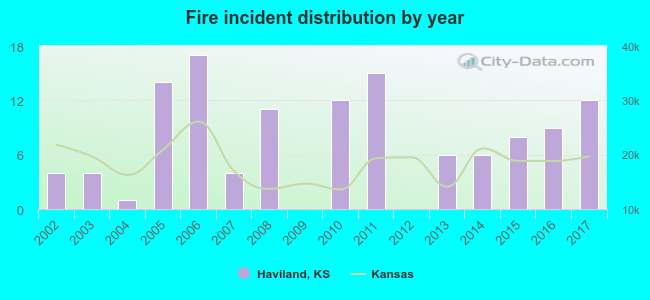 According to the data from the years 2002 - 2017 the average number of fires per year is 8. The highest number of fires - 17 took place in 2006, and the least - 0 in 2009. The data has a growing trend.
 18.7% incidents where reported in the morning and 81.3% in the evening. The most fires (22.0%) took place on Friday, and the least (7.3%) on Sunday.
 Based on the 123 incident reports from years 2002 - 2017 most fires (18.7%) took place during April, and the least (2.4%) in May.
 Out of all 274 cases reported during the years 2002 - 2017, the most belonged to the categories: Fire (44.9%), Overpressure Rupture (42.3%), and Service Call (4.7%).
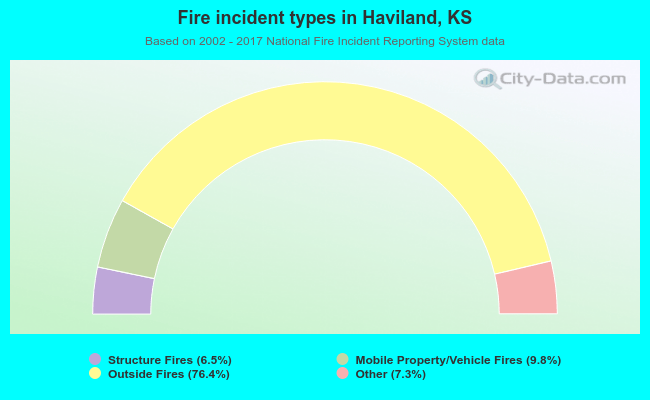 When looking into fire subcategories, the most incidents belonged to: Outside Fires (76.4%), and Mobile Property/Vehicle Fires (9.8%).