Hoffman Estates: Fire Incidents, Illinois (IL)
Where are fire incidents reported in Hoffman Estates, IL
Something went wrong! Please refresh the page.
| Fire incidents reported | |
|---|---|
| Sreet name | Count |
| HASSELL RD | 184 |
| HIGGINS RD | 158 |
| I90 | 108 |
| BARRINGTON RD | 106 |
| GOLF RD | 84 |
| ATLANTIC AV | 74 |
| BODE CIR | 74 |
| SALEM DR | 54 |
| BEVERLY RD | 50 |
| SUTTON RD | 50 |
| EB I90 | 46 |
| ROSELLE RD | 46 |
| ATLANTIC | 42 |
| WB I90 | 40 |
| HUNTINGTON BLV | 38 |
| BODE RD | 36 |
| SHOE FACTORY RD | 34 |
| CENTRAL RD | 30 |
| HILL DR | 30 |
| HIGGINS QUARTER DR | 26 |
| BRANDT DR | 24 |
| ILLINOIS BLV | 24 |
| KINGSDALE RD | 24 |
| BASSWOOD ST | 22 |
| GLEN LAKE RD | 22 |
| MESA DR | 22 |
| PALATINE RD | 22 |
| ALGONQUIN RD | 20 |
| FLAGSTAFF LN | 20 |
| GOVERNORS LN | 20 |
| Other | 207 |
2002 - 2018 National Fire Incident Reporting System (NFIRS) incidents
- Incident types reported to NFIRS in Hoffman Estates, IL
- 16,60462.0%Rescue & EMS
- 2,96211.1%False Alarm
- 2,3548.8%Hazardous Condition
- 1,7376.5%Fire
- 1,7066.4%Good Intent Call
- 1,3565.1%Service Call
- 380.1%Overpressure Rupture
- Fire incident types reported to NFIRS in Hoffman Estates, IL
- 89451.5%Structure Fires
- 49528.5%Outside Fires
- 28316.3%Mobile Property/Vehicle Fires
- 653.7%Other
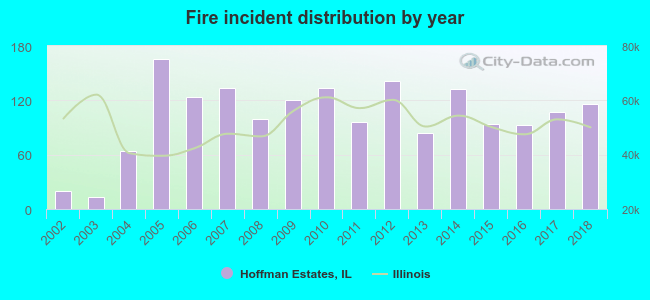 According to the data from the years 2002 - 2018 the average number of fire incidents per year is 102. The highest number of reported fire incidents - 166 took place in 2005, and the least - 13 in 2003. The data has a rising trend.
The average number of yearly fire incidents per 10k residents in Hoffman Estates, IL compared to nearest cities:
(Note: Based on data for the last 3 years, including only cities with population 5,000 and above)
| Hoffman Estates: | 20.1 |
| Schaumburg: | 18.3 |
| Inverness: | 18.9 |
| Streamwood: | 21.8 |
| Rolling Meadows: | 23.9 |
| Palatine: | 20.6 |
| Roselle: | 37.8 |
| Hanover Park: | 24.4 |
| Barrington: | 52.1 |
 The median response time based on all reported fire incidents is 5 minutes. This is about the same as the Illinois median value.
The median response time in Hoffman Estates, IL compared to nearest cities:
(Note: Based on data for all years, including only cities with at least 500 fire incidents)
| Hoffman Estates: | 5 minutes |
| Schaumburg: | 5 minutes |
| Streamwood: | 5 minutes |
| Rolling Meadows: | 5 minutes |
| Palatine: | 5 minutes |
| Roselle: | 6 minutes |
| Hanover Park: | 4 minutes |
| Barrington: | 7 minutes |
| Bartlett: | 5 minutes |
 Based on the reports from the years 2002 - 2018 the average number of fire-related fatalities per year is 0. The highest number of reported deaths - 2 took place in 2014, and the lowest - 0 in 2002. The data has a constant trend.
 Based on the reports from the years 2002 - 2018 the average number of fire-related yearly casualties is 2. The highest number of reported injuries - 8 took place in 2006, and the lowest - 0 in 2002. The data has a growing trend.
The average number of casualties per 1,000 fires is 21. This indicator was the highest - 65 in 2006, and the lowest 0 in 2002. The trend for injuries per 1,000 fires is rising. Compared to the Illinois value the number of casualties per 1,000 fire incidents is much higher.
Based on the reports from the years 2002 - 2018 the average number of fire-related yearly casualties is 2. The highest number of reported injuries - 8 took place in 2006, and the lowest - 0 in 2002. The data has a growing trend.
The average number of casualties per 1,000 fires is 21. This indicator was the highest - 65 in 2006, and the lowest 0 in 2002. The trend for injuries per 1,000 fires is rising. Compared to the Illinois value the number of casualties per 1,000 fire incidents is much higher.Casualties per 1,000 incidents in Hoffman Estates, IL compared to nearest cities:
(Note: Based on data for all years, including only cities with at least 500 fire incidents)
| Hoffman Estates: | 23.6 |
| Schaumburg: | 9.7 |
| Streamwood: | 15.0 |
| Rolling Meadows: | 19.4 |
| Palatine: | 16.4 |
| Roselle: | 12.6 |
| Hanover Park: | 36.5 |
| Barrington: | 5.8 |
| Bartlett: | 11.6 |
 30.9% incidents where reported in the morning and 69.1% in the evening. The most fires (15.7%) took place on Thursday, and the least (13.0%) on Friday.
 According to the 1,737 reports from years 2002 - 2018 most fires (10.4%) took place during July, and the least (6.3%) in February.
 Out of all 26,769 cases reported during the years 2002 - 2018, the most belonged to the categories: Rescue & EMS (62.0%), False Alarm (11.1%), and Hazardous Condition (8.8%).
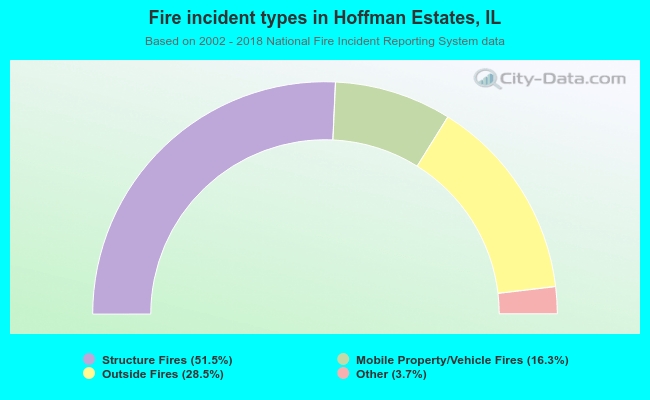 When looking into fire subcategories, the most reports belonged to: Structure Fires (51.5%), and Outside Fires (28.5%).