Hope: Fire Incidents, Kansas (KS)
Where are fire incidents reported in Hope, KS
Something went wrong! Please refresh the page.
|
| |||||||||||||||||||||||||||||||||||||||||||||||||||||||||||||||||||||||||||||||||||||||||||||||||||||||||||||
2002 - 2018 National Fire Incident Reporting System (NFIRS) incidents
- Incident types reported to NFIRS in Hope, KS
- 37586.4%Fire
- 276.2%Rescue & EMS
- 143.2%False Alarm
- 92.1%Good Intent Call
- 81.8%Hazardous Condition
- 10.2%Overpressure Rupture
- Fire incident types reported to NFIRS in Hope, KS
- 27072.0%Outside Fires
- 5614.9%Structure Fires
- 4110.9%Mobile Property/Vehicle Fires
- 82.1%Other
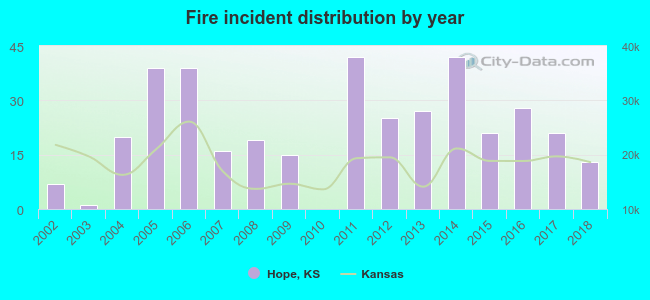 According to the data from the years 2002 - 2018 the average number of fires per year is 22. The highest number of fires - 42 took place in 2011, and the least - 0 in 2010. The data has a growing trend.
 52.8% incidents where reported in the morning and 47.2% in the evening. The most fires (17.9%) took place on Tuesday, and the least (10.9%) on Monday.
 According to the 375 incident reports from years 2002 - 2018 most fires (20.5%) took place during March, and the least (2.7%) in October.
 Out of all 434 cases reported during the years 2002 - 2018, the most belonged to the categories: Fire (86.4%), Rescue & EMS (6.2%), and Good Intent Call (3.2%).
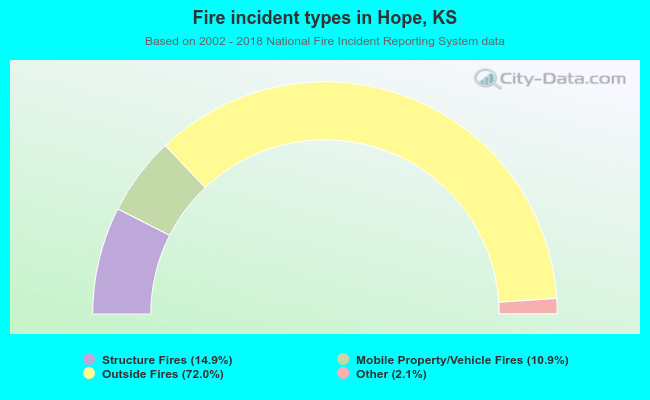 When looking into fire subcategories, the most incidents belonged to: Outside Fires (72.0%), and Structure Fires (14.9%).