Horseshoe Bay: Fire Incidents, Texas (TX)
Where are fire incidents reported in Horseshoe Bay, TX
Something went wrong! Please refresh the page.
|
| |||||||||||||||||||||||||||||||||||||||||||||||||||||||||||||||||||||||||||||||||||||||||||||||||||||||||||||
| Other | 167 | |||||||||||||||||||||||||||||||||||||||||||||||||||||||||||||||||||||||||||||||||||||||||||||||||||||||||||||
2002 - 2018 National Fire Incident Reporting System (NFIRS) incidents
- Incident types reported to NFIRS in Horseshoe Bay, TX
- 1,88151.1%Rescue & EMS
- 47713.0%Fire
- 44112.0%Good Intent Call
- 37610.2%False Alarm
- 2847.7%Hazardous Condition
- 1784.8%Service Call
- 270.7%Severe Weather
- 110.3%Special Incident
- 60.2%Overpressure Rupture
- Fire incident types reported to NFIRS in Horseshoe Bay, TX
- 25954.3%Outside Fires
- 14129.6%Structure Fires
- 398.2%Mobile Property/Vehicle Fires
- 388.0%Other
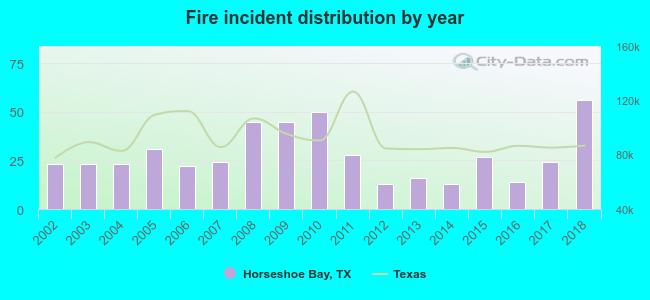 Based on the data from the years 2002 - 2018 the average number of fire incidents per year is 28. The highest number of reported fire incidents - 56 took place in 2018, and the least - 13 in 2012. The data has a rising trend.
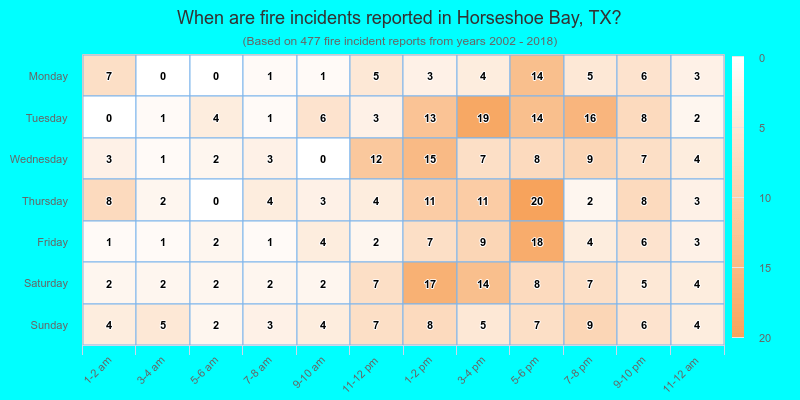
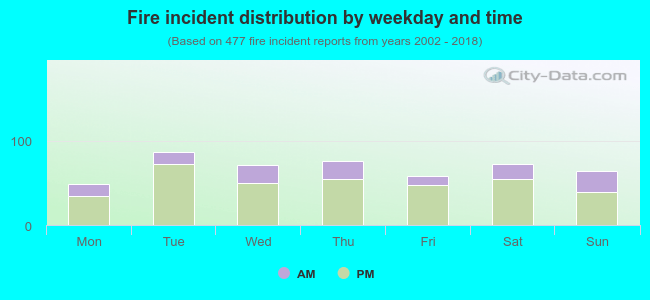 26.0% incidents where reported in the morning and 74.0% in the evening. The most fires (18.2%) took place on Tuesday, and the least (10.3%) on Monday.
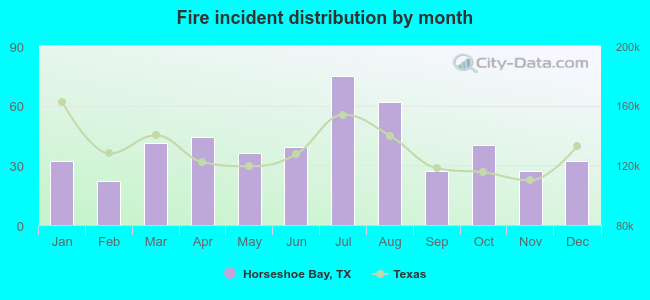 Based on the 477 fires from years 2002 - 2018 most fires (15.7%) took place during July, and the least (4.6%) in February.
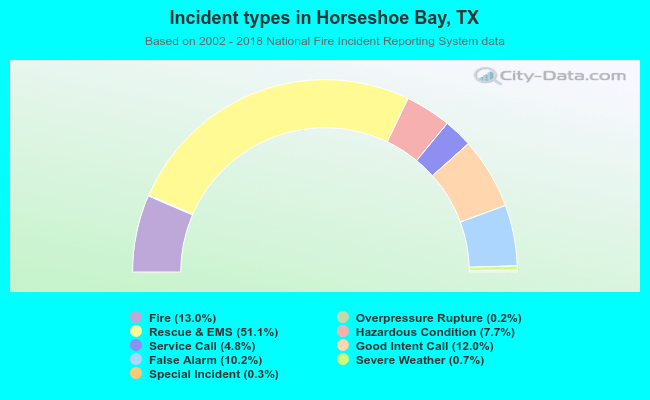 Out of all 3,681 cases reported during the years 2002 - 2018, the most belonged to the categories: Rescue & EMS (51.1%), Fire (13.0%), and Good Intent Call (12.0%).
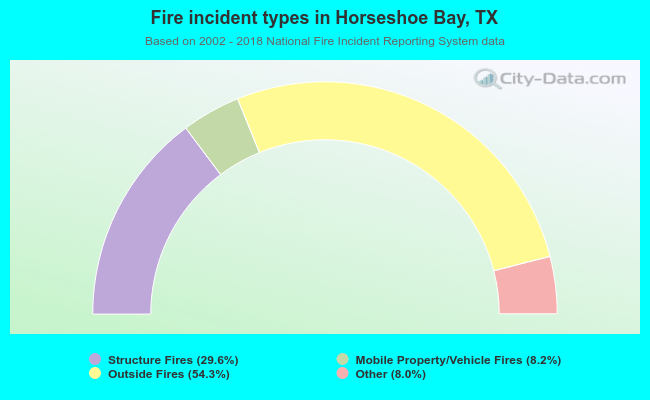 When looking into fire subcategories, the most incidents belonged to: Outside Fires (54.3%), and Structure Fires (29.6%).