Inyokern: Fire Incidents, California (CA)
Where are fire incidents reported in Inyokern, CA
Something went wrong! Please refresh the page.
|
| |||||||||||||||||||||||||||||||||||||||||||||||||||||||||||||||||||||||||||||||||||||||||||||||||||||||||||||
2005 - 2018 National Fire Incident Reporting System (NFIRS) incidents
- Incident types reported to NFIRS in Inyokern, CA
- 96950.8%Rescue & EMS
- 26613.9%Good Intent Call
- 26313.8%Fire
- 22711.9%Hazardous Condition
- 924.8%Service Call
- 683.6%False Alarm
- 231.2%Special Incident
- Fire incident types reported to NFIRS in Inyokern, CA
- 11041.8%Outside Fires
- 10841.1%Structure Fires
- 4517.1%Mobile Property/Vehicle Fires
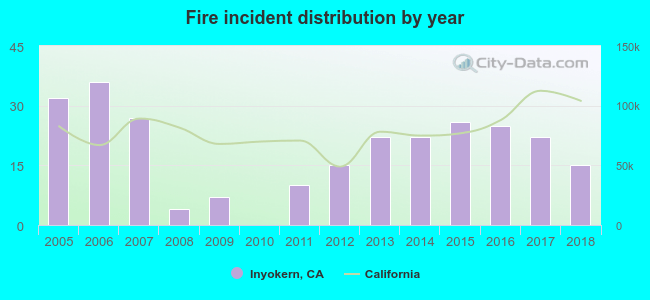 According to the data from the years 2005 - 2018 the average number of fire incidents per year is 19. The highest number of reported fire incidents - 36 took place in 2006, and the least - 0 in 2010. The data has a declining trend.
 Based on the data from the years 2005 - 2018 the average number of fire-related yearly casualties is 0. The highest number of reported injuries - 2 took place in 2012, and the lowest - 0 in 2005. The data has a constant trend.
 31.6% incidents where reported in the morning and 68.4% in the evening. The most fires (18.3%) took place on Saturday, and the least (10.6%) on Wednesday.
 Based on the 263 incident reports from years 2005 - 2018 most fires (12.2%) took place during June, and the least (4.9%) in February.
 Out of all 1,909 cases reported during the years 2005 - 2018, the most belonged to the categories: Rescue & EMS (50.8%), Good Intent Call (13.9%), and Fire (13.8%).
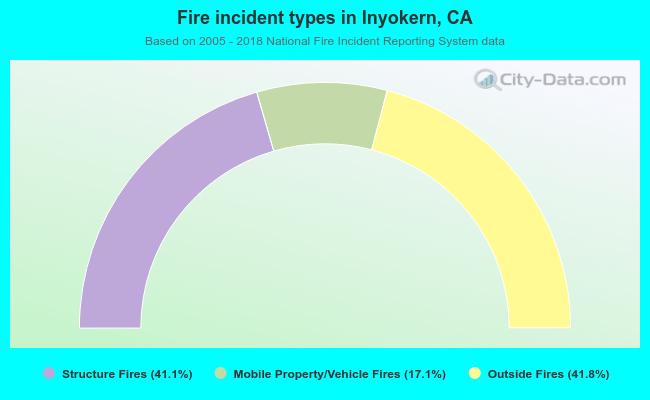 When looking into fire subcategories, the most incidents belonged to: Outside Fires (41.8%), and Structure Fires (41.1%).