Irondale: Fire Incidents, Alabama (AL)
Where are fire incidents reported in Irondale, AL
Something went wrong! Please refresh the page.
| Fire incidents reported | |
|---|---|
| Sreet name | Count |
| ALTON RD | 241 |
| CRESTWOOD BLVD | 217 |
| BEACON DR | 179 |
| RUFFNER RD | 155 |
| I-459 NORTH | 154 |
| I-20 EAST | 150 |
| GRANTS MILL RD | 124 |
| I-459 SOUTH | 122 |
| I459 NORTH | 120 |
| HIGHWAY 78 | 116 |
| OLD LEEDS RD | 116 |
| I-20 WEST | 113 |
| 2ND AVE | 112 |
| AMBER HILLS RD | 97 |
| NORFOLK SOUTHERN DR | 88 |
| SHARPSBURG CIR | 86 |
| 1ST AVE | 80 |
| I20 EAST | 75 |
| HAGBUSH RD | 68 |
| OLD GRANTS MILL RD | 61 |
| GOLDMAR DR | 58 |
| 3RD AVE | 55 |
| I20 WEST | 55 |
| KILGORE MEMORIAL DR | 54 |
| CROWLEY DR | 52 |
| DANTON LANE | 47 |
| I459 SOUTH | 45 |
| COMMERCE BLVD | 41 |
| HUNTER RIDGE DR | 40 |
| MEADOWS DR | 40 |
2002 - 2018 National Fire Incident Reporting System (NFIRS) incidents
- Incident types reported to NFIRS in Irondale, AL
- 5,66659.8%Rescue & EMS
- 1,25113.2%Fire
- 99410.5%Service Call
- 6877.3%False Alarm
- 4204.4%Good Intent Call
- 3894.1%Hazardous Condition
- 260.3%Special Incident
- 230.2%Overpressure Rupture
- 120.1%Severe Weather
- Fire incident types reported to NFIRS in Irondale, AL
- 51941.5%Outside Fires
- 34727.7%Structure Fires
- 32125.7%Mobile Property/Vehicle Fires
- 645.1%Other
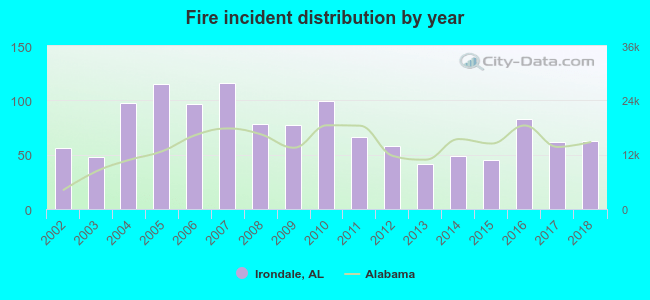 Based on the data from the years 2002 - 2018 the average number of fires per year is 74. The highest number of reported fire incidents - 116 took place in 2007, and the least - 41 in 2013. The data has a rising trend.
The average number of yearly fire incidents per 10k residents in Irondale, AL compared to nearest cities:
(Note: Based on data for the last 3 years, including only cities with population 5,000 and above)
| Irondale: | 55.7 |
| Mountain Brook: | 11.4 |
| Tarrant: | 58.6 |
| Birmingham: | 87.0 |
| Center Point: | 49.5 |
| Leeds: | 53.0 |
| Trussville: | 18.4 |
| Homewood: | 35.3 |
| Vestavia Hills: | 20.2 |
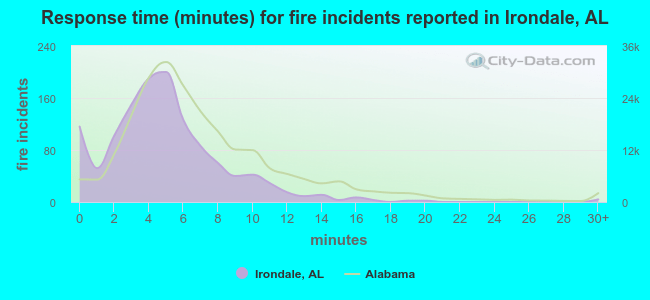 The median response time based on all reported fire incidents is 5 minutes. This is lower than the state median value.
The median response time in Irondale, AL compared to nearest cities:
(Note: Based on data for all years, including only cities with at least 500 fire incidents)
| Irondale: | 5 minutes |
| Tarrant: | 3 minutes |
| Birmingham: | 6 minutes |
| Leeds: | 5 minutes |
| Trussville: | 7 minutes |
| Homewood: | 6 minutes |
| Vestavia Hills: | 4 minutes |
| Pinson: | 6 minutes |
| Hoover: | 5 minutes |
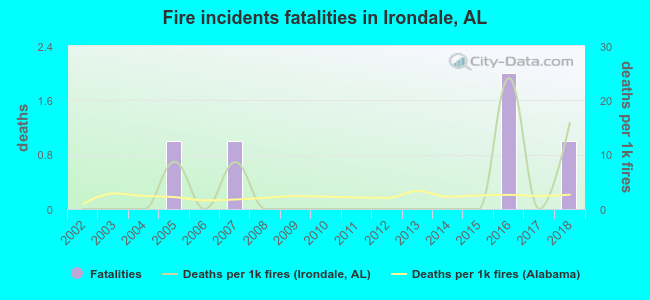 Based on the reports from the years 2002 - 2018 the average number of fire-related yearly deaths is 0. The highest number of deaths - 2 took place in 2016, and the lowest - 0 in 2002. The data has a rising trend.
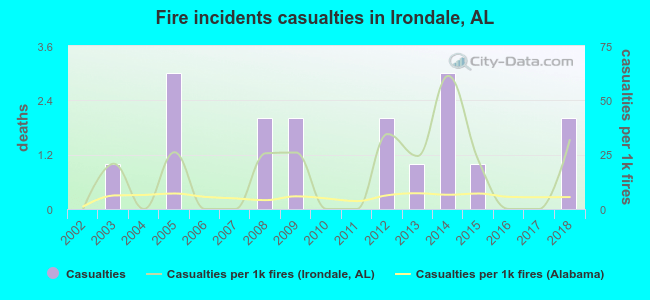 According to the reports from the years 2002 - 2018 the average number of fire-related casualties per year is 1. The highest number of injuries - 3 took place in 2005, and the lowest - 0 in 2002. The data has an increasing trend.
The average number of casualties per 1,000 fires is 16. This indicator was the highest - 61 in 2014, and the lowest 0 in 2002. The trend for casualties per 1,000 incidents is rising. Compared to the state value the number of casualties per 1,000 incidents is much higher.
According to the reports from the years 2002 - 2018 the average number of fire-related casualties per year is 1. The highest number of injuries - 3 took place in 2005, and the lowest - 0 in 2002. The data has an increasing trend.
The average number of casualties per 1,000 fires is 16. This indicator was the highest - 61 in 2014, and the lowest 0 in 2002. The trend for casualties per 1,000 incidents is rising. Compared to the state value the number of casualties per 1,000 incidents is much higher.Casualties per 1,000 incidents in Irondale, AL compared to nearest cities:
(Note: Based on data for all years, including only cities with at least 500 fire incidents)
| Irondale: | 13.6 |
| Tarrant: | 3.9 |
| Birmingham: | 5.1 |
| Leeds: | 5.8 |
| Trussville: | 2.6 |
| Homewood: | 3.9 |
| Vestavia Hills: | 19.5 |
| Pinson: | 15.8 |
| Hoover: | 9.0 |
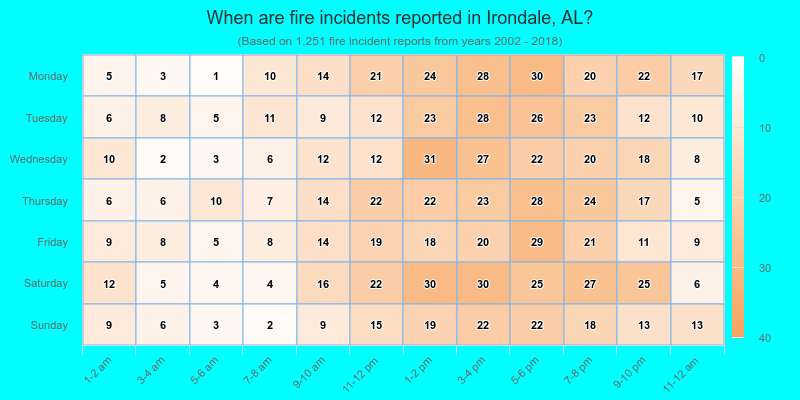
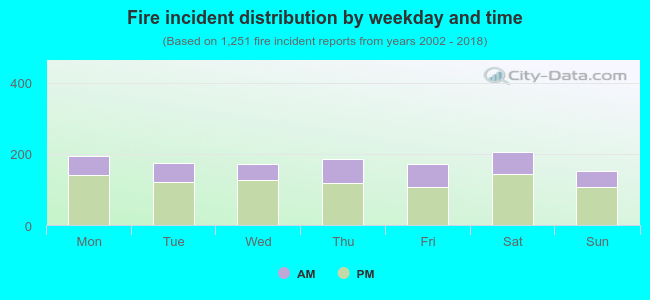 30.8% incidents where reported in the morning and 69.2% in the evening. The most fires (16.5%) took place on Saturday, and the least (12.1%) on Sunday.
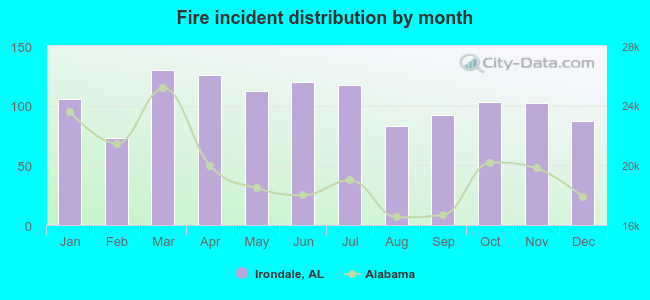 Based on the 1,251 incident reports from years 2002 - 2018 most fires (10.4%) took place during March, and the least (5.8%) in February.
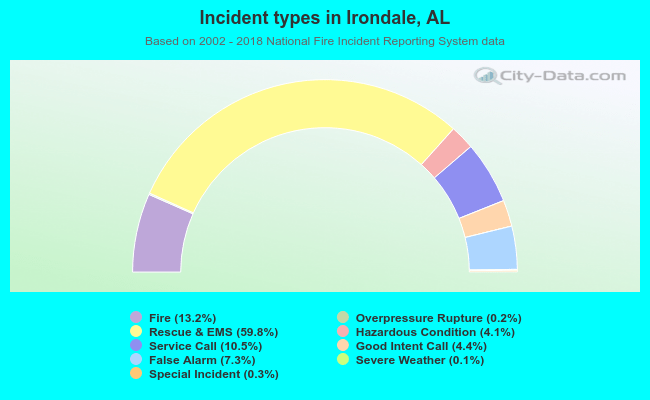 Out of all 9,468 cases reported during the years 2002 - 2018, the most belonged to the categories: Rescue & EMS (59.8%), Fire (13.2%), and Service Call (10.5%).
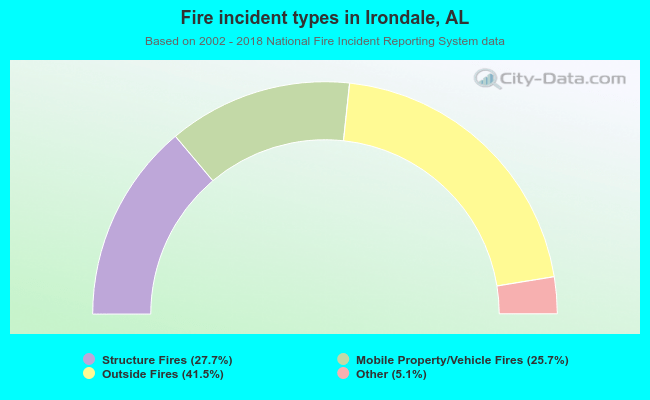 When looking into fire subcategories, the most reports belonged to: Outside Fires (41.5%), and Structure Fires (27.7%).