Jacksonville: Fire Incidents, Florida (FL)
Where are fire incidents reported in Jacksonville, FL
Something went wrong! Please refresh the page.
| Fire incidents reported | |
|---|---|
| Sreet name | Count |
| 103 RD ST | 394 |
| BEACH BV | 378 |
| I 95 ST | 378 |
| ATLANTIC BV | 366 |
| I 295 ST | 366 |
| NORMANDY BV | 318 |
| BEAVER ST | 312 |
| UNIVERSITY BV | 312 |
| MAIN ST | 304 |
| LEM TURNER RD | 244 |
| OLD KINGS RD | 224 |
| MONCRIEF RD | 222 |
| PHILLIPS HY | 214 |
| LANE AV | 208 |
| MAYPORT RD | 206 |
| BLANDING BV | 198 |
| SR 9A ST | 192 |
| I 10 ST | 190 |
| ARLINGTON XY | 186 |
| COLLINS RD | 182 |
| SOUTHSIDE BV | 180 |
| MONUMENT RD | 178 |
| NEW KINGS RD | 176 |
| SAN JOSE BV | 172 |
| ATLANTIC BLVD | 170 |
| EDGEWOOD AV | 168 |
| OLD ST AUGUSTINE RD | 168 |
| ST JOHNS BLUFF RD | 168 |
| BEACH BLVD | 158 |
| SAN PABLO RD | 156 |
| Other | 16,174 |
2003 - 2018 National Fire Incident Reporting System (NFIRS) incidents
- Incident types reported to NFIRS in Jacksonville, FL
- 175,50164.7%Rescue & EMS
- 34,06512.6%Good Intent Call
- 23,2628.6%Fire
- 12,7374.7%False Alarm
- 12,2824.5%Service Call
- 12,1894.5%Hazardous Condition
- 8230.3%Special Incident
- Fire incident types reported to NFIRS in Jacksonville, FL
- 10,65145.8%Outside Fires
- 6,57628.3%Structure Fires
- 4,36018.7%Mobile Property/Vehicle Fires
- 1,6757.2%Other
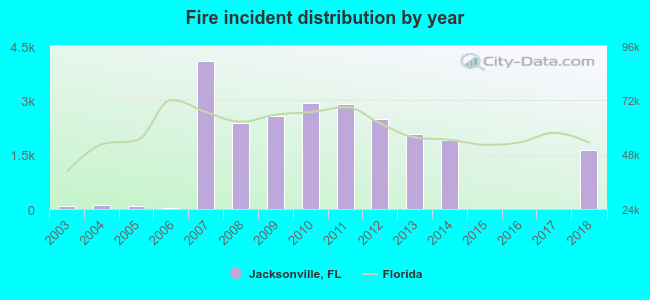 According to the data from the years 2003 - 2018 the average number of fire incidents per year is 1,452. The highest number of fire incidents - 4,093 took place in 2007, and the least - 5 in 2016. The data has an increasing trend.
The average number of yearly fire incidents per 10k residents in Jacksonville, FL compared to nearest cities:
(Note: Based on data for the last 3 years, including only cities with population 5,000 and above)
| Jacksonville: | 6.4 |
| Orange Park: | 19.8 |
| Atlantic Beach: | 3.3 |
| Neptune Beach: | 2.3 |
| Fleming Island: | 1.3 |
| Jacksonville Beach: | 27.2 |
| Ponte Vedra: | 11.0 |
| Yulee: | 63.8 |
| Green Cove Springs: | 4.2 |
 The median response time based on all reported fire incidents is 6 minutes. This is similar to the state median value.
The median response time in Jacksonville, FL compared to nearest cities:
(Note: Based on data for all years, including only cities with at least 500 fire incidents)
| Jacksonville: | 6 minutes |
| Orange Park: | 6 minutes |
| Jacksonville Beach: | 4 minutes |
| Callahan: | 9 minutes |
| Yulee: | 9 minutes |
| Middleburg: | 10 minutes |
| Fernandina Beach: | 6 minutes |
| Macclenny: | 6 minutes |
| Hilliard: | 12 minutes |
 According to the reports from the years 2003 - 2018 the average number of fire-related fatalities per year is 3. The highest number of reported deaths - 11 took place in 2009, and the lowest - 0 in 2003. The data has a growing trend.
The average number of deaths per 1,000 fires is 1. This indicator was the highest - 4 in 2009, and the lowest 0 in 2003. The trend for deaths per 1,000 incidents is increasing. Compared to the Florida value the number of fatalities per 1,000 incidents is higher.
According to the reports from the years 2003 - 2018 the average number of fire-related fatalities per year is 3. The highest number of reported deaths - 11 took place in 2009, and the lowest - 0 in 2003. The data has a growing trend.
The average number of deaths per 1,000 fires is 1. This indicator was the highest - 4 in 2009, and the lowest 0 in 2003. The trend for deaths per 1,000 incidents is increasing. Compared to the Florida value the number of fatalities per 1,000 incidents is higher.Deaths per 1,000 incidents in Jacksonville, FL compared to nearest cities:
(Note: Based on data for all years, including only cities with at least 2,500 fire incidents)
| Jacksonville: | 2.1 |
| St. Augustine: | 2.3 |
| Palatka: | 1.1 |
| Lake City: | 2.1 |
| Palm Coast: | 3.1 |
| Gainesville: | 1.7 |
 According to the reports from the years 2003 - 2018 the average number of fire-related casualties per year is 13. The highest number of reported casualties - 38 took place in 2014, and the lowest - 0 in 2003. The data has a growing trend.
The average number of casualties per 1,000 fires is 8. This indicator was the highest - 48 in 2004, and the lowest 0 in 2003. The trend for casualties per 1,000 incidents is growing. Compared to the Florida value the number of injuries per 1,000 fires is lower.
According to the reports from the years 2003 - 2018 the average number of fire-related casualties per year is 13. The highest number of reported casualties - 38 took place in 2014, and the lowest - 0 in 2003. The data has a growing trend.
The average number of casualties per 1,000 fires is 8. This indicator was the highest - 48 in 2004, and the lowest 0 in 2003. The trend for casualties per 1,000 incidents is growing. Compared to the Florida value the number of injuries per 1,000 fires is lower.Casualties per 1,000 incidents in Jacksonville, FL compared to nearest cities:
(Note: Based on data for all years, including only cities with at least 500 fire incidents)
| Jacksonville: | 8.7 |
| Orange Park: | 0.5 |
| Jacksonville Beach: | 43.7 |
| Callahan: | 1.0 |
| Yulee: | 0.5 |
| Middleburg: | 1.0 |
| Fernandina Beach: | 3.2 |
| Macclenny: | 1.0 |
| Hilliard: | 1.2 |
 30.4% incidents where reported in the morning and 69.6% in the evening. The most fires (15.5%) took place on Saturday, and the least (13.4%) on Tuesday.
 According to the 23,262 fires from years 2003 - 2018 most fires (11.1%) took place during April, and the least (6.3%) in September.
 Out of all 271,085 cases reported during the years 2003 - 2018, the most belonged to the categories: Rescue & EMS (64.7%), Good Intent Call (12.6%), and Fire (8.6%).
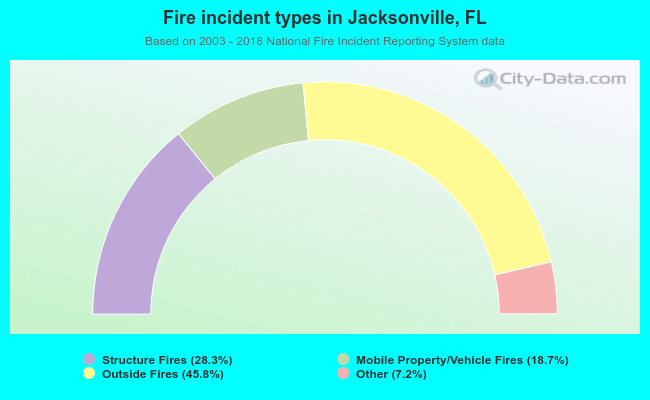 When looking into fire subcategories, the most reports belonged to: Outside Fires (45.8%), and Structure Fires (28.3%).