Jefferson: Fire Incidents, Louisiana (LA)
Where are fire incidents reported in Jefferson, LA
Something went wrong! Please refresh the page.
|
| |||||||||||||||||||||||||||||||||||||||||||||||||||||||||||||||||||||||||||||||||||||||||||||||||||||||||||||
2007 - 2018 National Fire Incident Reporting System (NFIRS) incidents
- Incident types reported to NFIRS in Jefferson, LA
- 1,24731.6%False Alarm
- 77019.5%Rescue & EMS
- 60915.4%Fire
- 58814.9%Hazardous Condition
- 46811.9%Good Intent Call
- 2406.1%Service Call
- 120.3%Special Incident
- 70.2%Severe Weather
- Fire incident types reported to NFIRS in Jefferson, LA
- 21435.1%Structure Fires
- 21134.6%Outside Fires
- 16026.3%Mobile Property/Vehicle Fires
- 243.9%Other
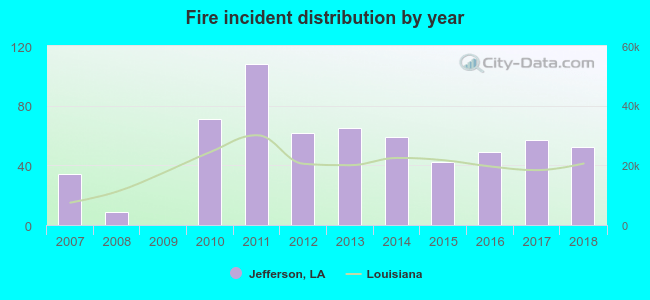 Based on the data from the years 2007 - 2018 the average number of fires per year is 51. The highest number of reported fires - 108 took place in 2011, and the least - 0 in 2009. The data has a rising trend.
The average number of yearly fire incidents per 10k residents in Jefferson, LA compared to nearest cities:
(Note: Based on data for the last 3 years, including only cities with population 5,000 and above)
| Jefferson: | 47.1 |
| Metairie: | 15.6 |
| Bridge City: | 23.4 |
| Harahan: | 3.9 |
| River Ridge: | 15.3 |
| Westwego: | 38.6 |
| Waggaman: | 26.3 |
| New Orleans: | 17.3 |
| Marrero: | 60.6 |
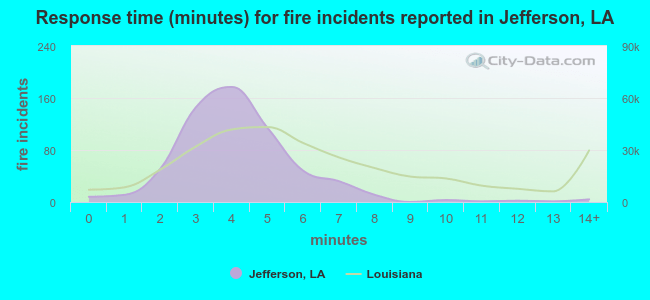 The median response time based on all reported fire incidents is 4 minutes. This is lower than the state median value.
The median response time in Jefferson, LA compared to nearest cities:
(Note: Based on data for all years, including only cities with at least 500 fire incidents)
| Jefferson: | 4 minutes |
| Metairie: | 4 minutes |
| Westwego: | 2 minutes |
| Avondale: | 3 minutes |
| New Orleans: | 5 minutes |
| Marrero: | 4 minutes |
| Kenner: | 6 minutes |
| Gretna: | 3 minutes |
| Harvey: | 4 minutes |
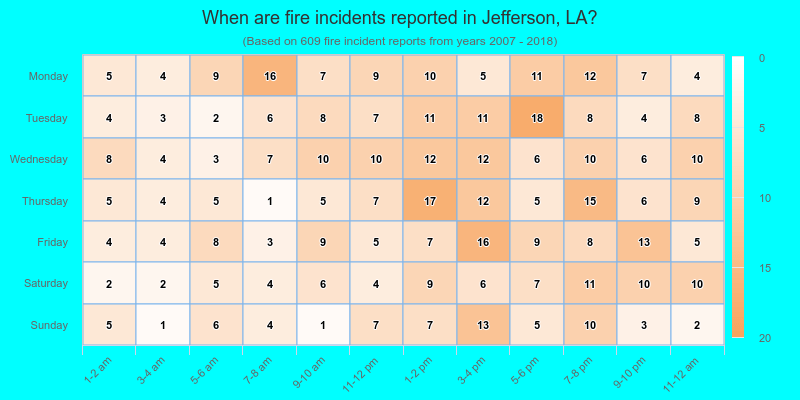
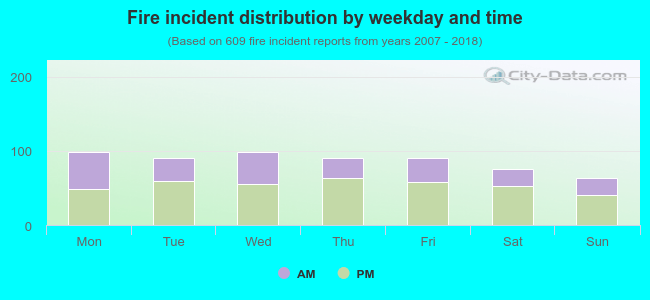 37.6% incidents where reported in the morning and 62.4% in the evening. The most fires (16.3%) took place on Monday, and the least (10.5%) on Sunday.
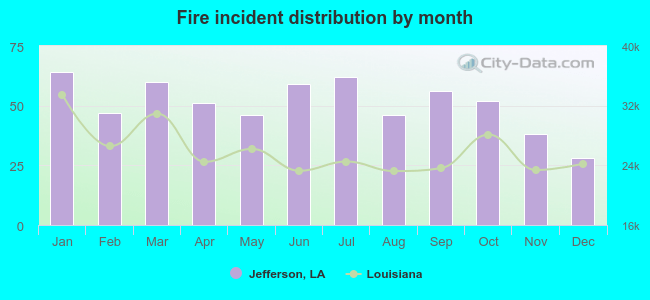 According to the 609 reports from years 2007 - 2018 most fires (10.5%) took place during January, and the least (4.6%) in December.
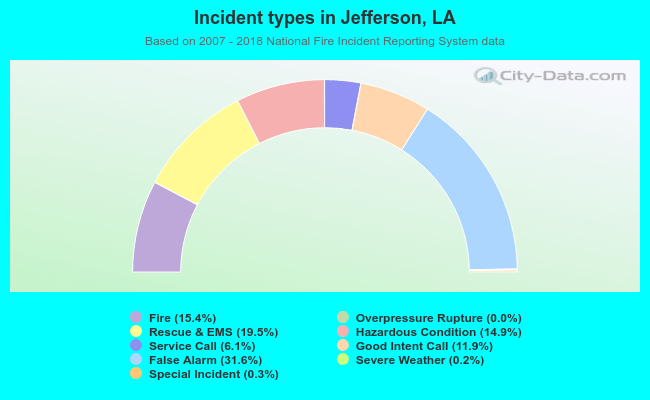 Out of all 3,942 cases reported during the years 2007 - 2018, the most belonged to the categories: False Alarm (31.6%), Rescue & EMS (19.5%), and Fire (15.4%).
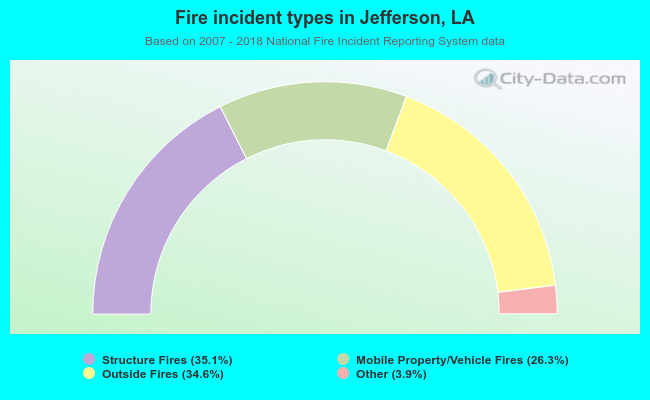 When looking into fire subcategories, the most incidents belonged to: Structure Fires (35.1%), and Outside Fires (34.6%).