Kalona: Fire Incidents, Iowa (IA)
Where are fire incidents reported in Kalona, IA
Something went wrong! Please refresh the page.
|
| |||||||||||||||||||||||||||||||||||||||||||||||||||||||||||||||||||||||||||||||||||||||||||||||||||||||||||||
2002 - 2018 National Fire Incident Reporting System (NFIRS) incidents
- Incident types reported to NFIRS in Kalona, IA
- 47258.1%Fire
- 10212.6%Rescue & EMS
- 8610.6%Good Intent Call
- 678.3%Hazardous Condition
- 435.3%False Alarm
- 313.8%Service Call
- 60.7%Overpressure Rupture
- 50.6%Severe Weather
- Fire incident types reported to NFIRS in Kalona, IA
- 22046.6%Outside Fires
- 19841.9%Structure Fires
- 459.5%Mobile Property/Vehicle Fires
- 91.9%Other
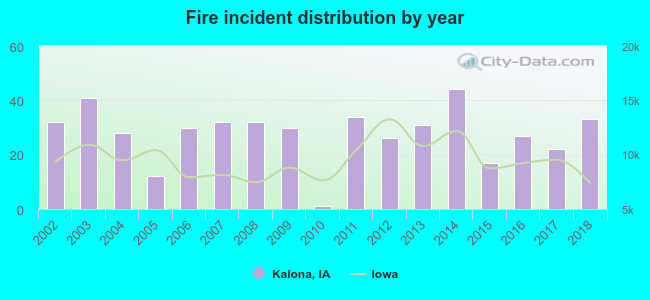 Based on the data from the years 2002 - 2018 the average number of fire incidents per year is 28. The highest number of reported fires - 44 took place in 2014, and the least - 1 in 2010. The data has an increasing trend.
 27.5% incidents where reported in the morning and 72.5% in the evening. The most fires (17.8%) took place on Wednesday, and the least (11.9%) on Thursday.
 According to the 472 reports from years 2002 - 2018 most fires (17.2%) took place during April, and the least (4.7%) in June.
 Out of all 812 cases reported during the years 2002 - 2018, the most belonged to the categories: Fire (58.1%), Rescue & EMS (12.6%), and Good Intent Call (10.6%).
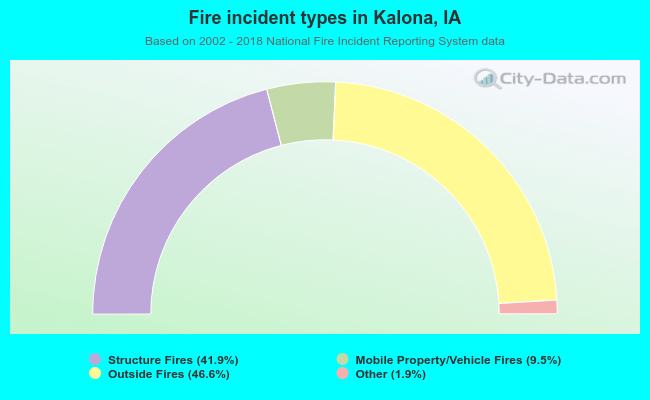 When looking into fire subcategories, the most incidents belonged to: Outside Fires (46.6%), and Structure Fires (41.9%).