Lake Isabella: Fire Incidents, California (CA)
Where are fire incidents reported in Lake Isabella, CA
Something went wrong! Please refresh the page.
|
| |||||||||||||||||||||||||||||||||||||||||||||||||||||||||||||||||||||||||||||||||||||||||||||||||||||||||||||
2005 - 2018 National Fire Incident Reporting System (NFIRS) incidents
- Incident types reported to NFIRS in Lake Isabella, CA
- 2,42954.2%Rescue & EMS
- 93320.8%Good Intent Call
- 4149.2%Fire
- 2926.5%Hazardous Condition
- 2575.7%Service Call
- 1292.9%False Alarm
- 160.4%Special Incident
- 100.2%Overpressure Rupture
- Fire incident types reported to NFIRS in Lake Isabella, CA
- 19446.9%Outside Fires
- 15437.2%Structure Fires
- 6415.5%Mobile Property/Vehicle Fires
- 20.5%Other
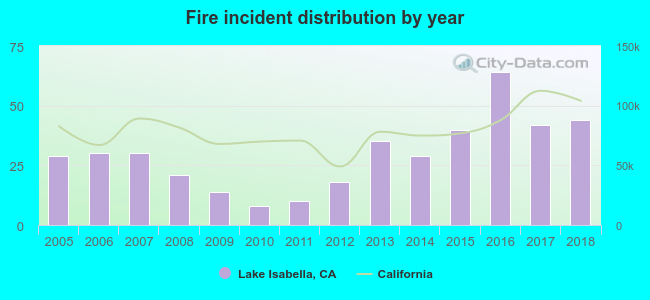 According to the data from the years 2005 - 2018 the average number of fires per year is 30. The highest number of fires - 64 took place in 2016, and the least - 8 in 2010. The data has a growing trend.
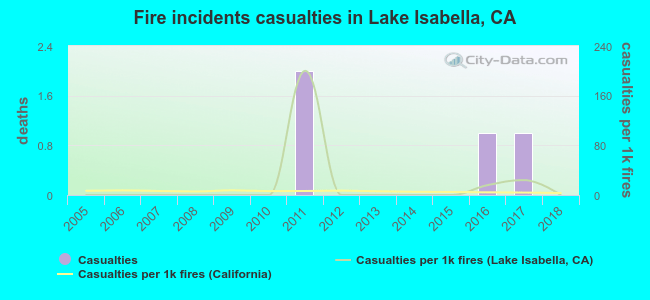 Based on the data from the years 2005 - 2018 the average number of fire-related casualties per year is 0. The highest number of reported injuries - 2 took place in 2011, and the lowest - 0 in 2005. The data has a constant trend.
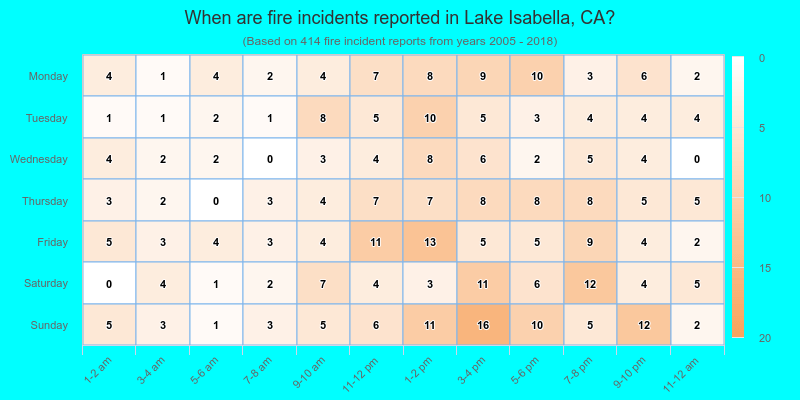
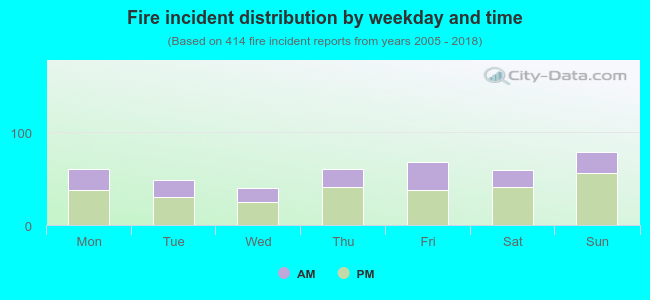 35.0% incidents where reported in the morning and 65.0% in the evening. The most fires (19.1%) took place on Sunday, and the least (9.7%) on Wednesday.
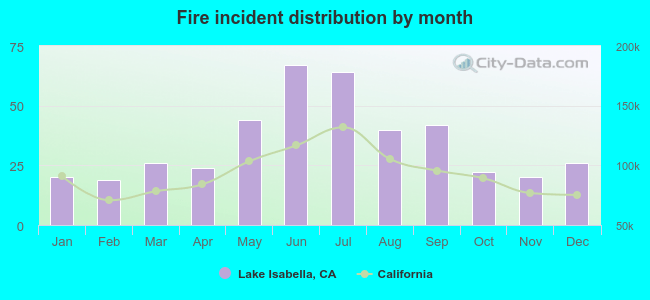 According to the 414 fire incident reports from years 2005 - 2018 most fires (16.2%) took place during June, and the least (4.6%) in February.
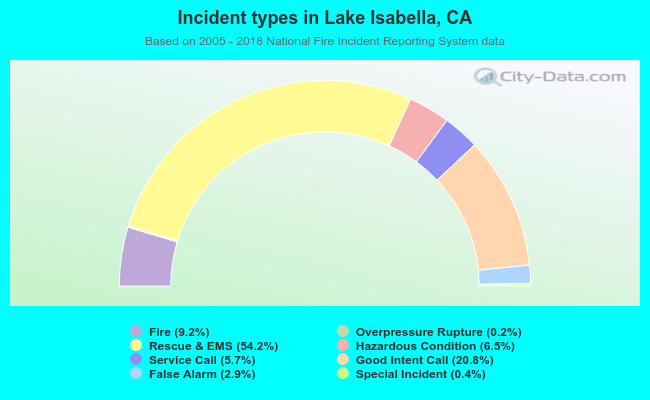 Out of all 4,480 cases reported during the years 2005 - 2018, the most belonged to the categories: Rescue & EMS (54.2%), Good Intent Call (20.8%), and Fire (9.2%).
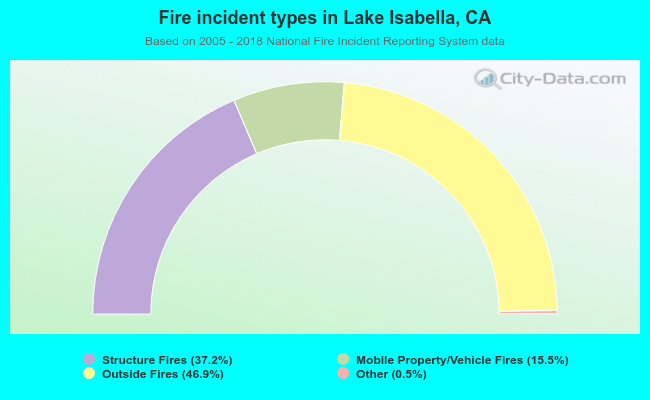 When looking into fire subcategories, the most reports belonged to: Outside Fires (46.9%), and Structure Fires (37.2%).