Lancaster: Fire Incidents, Ohio (OH)
Where are fire incidents reported in Lancaster, OH
Something went wrong! Please refresh the page.
| Fire incidents reported | |
|---|---|
| Sreet name | Count |
| MAIN ST | 506 |
| COLUMBUS ST | 292 |
| MEMORIAL DR | 260 |
| FAIR AVE | 198 |
| BROAD ST | 184 |
| WHEELING ST | 164 |
| MULBERRY ST | 156 |
| SHERIDAN DR | 152 |
| CHESTNUT ST | 136 |
| HIGH ST | 136 |
| FIFTH AVE | 130 |
| SIXTH AVE | 122 |
| COONPATH RD | 114 |
| HAMBURG RD | 110 |
| MAPLE ST | 110 |
| WALNUT ST | 96 |
| HARRISON AVE | 94 |
| GARFIELD AVE | 92 |
| LAKE RD | 88 |
| WASHINGTON AVE | 88 |
| EWING ST | 78 |
| COLUMBUS-LANCASTER RD | 76 |
| LINCOLN AVE | 70 |
| KING ST | 66 |
| ALLEN ST | 64 |
| RIVER VALLEY CIR | 64 |
| SUGAR GROVE RD | 62 |
| OLD LOGAN RD | 58 |
| PIERCE AVE | 56 |
| RAINBOW DR | 54 |
| Other | 930 |
2002 - 2018 National Fire Incident Reporting System (NFIRS) incidents
- Incident types reported to NFIRS in Lancaster, OH
- 7,97135.8%Rescue & EMS
- 4,80621.6%Fire
- 3,86417.3%Hazardous Condition
- 2,31210.4%Service Call
- 1,6607.5%Good Intent Call
- 1,5627.0%False Alarm
- 520.2%Overpressure Rupture
- 350.2%Special Incident
- Fire incident types reported to NFIRS in Lancaster, OH
- 2,36249.1%Structure Fires
- 1,71335.6%Outside Fires
- 67013.9%Mobile Property/Vehicle Fires
- 611.3%Other
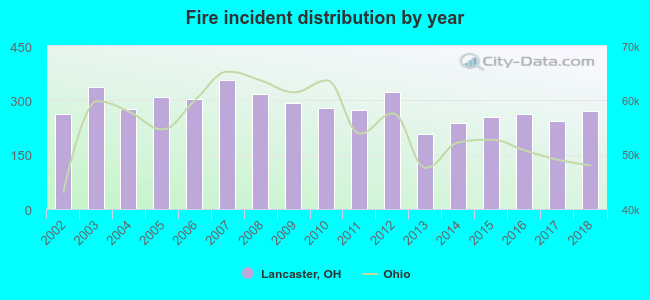 According to the data from the years 2002 - 2018 the average number of fires per year is 283. The highest number of fires - 357 took place in 2007, and the least - 206 in 2013. The data has a growing trend.
The average number of yearly fire incidents per 10k residents in Lancaster, OH compared to nearest cities:
(Note: Based on data for the last 3 years, including only cities with population 5,000 and above)
| Lancaster: | 65.3 |
| Canal Winchester: | 90.9 |
| Pickerington: | 30.2 |
| Logan: | 104.8 |
| Groveport: | 111.7 |
| Circleville: | 47.1 |
| Reynoldsburg: | 28.7 |
| Pataskala: | 73.5 |
| Whitehall: | 50.3 |
 The median response time based on all reported fire incidents is 5 minutes. This is lower than the state median value.
The median response time in Lancaster, OH compared to nearest cities:
(Note: Based on data for all years, including only cities with at least 500 fire incidents)
| Lancaster: | 5 minutes |
| Carroll: | 8 minutes |
| Amanda: | 13 minutes |
| Baltimore: | 7 minutes |
| Millersport: | 7 minutes |
| Canal Winchester: | 5 minutes |
| Pickerington: | 6 minutes |
| Thornville: | 10 minutes |
| Buckeye Lake: | 7 minutes |
 According to the reports from the years 2002 - 2018 the average number of fire-related yearly deaths is 0. The highest number of reported deaths - 1 took place in 2003, and the lowest - 0 in 2002. The data has a constant trend.
The average number of fatalities per 1,000 fire incidents is 1. This indicator was the highest - 4 in 2015, and the lowest 0 in 2002. The trend for deaths per 1,000 fires is constant. Compared to the Ohio value the number of deaths per 1,000 fires is much lower.
According to the reports from the years 2002 - 2018 the average number of fire-related yearly deaths is 0. The highest number of reported deaths - 1 took place in 2003, and the lowest - 0 in 2002. The data has a constant trend.
The average number of fatalities per 1,000 fire incidents is 1. This indicator was the highest - 4 in 2015, and the lowest 0 in 2002. The trend for deaths per 1,000 fires is constant. Compared to the Ohio value the number of deaths per 1,000 fires is much lower.
 Based on the data from the years 2002 - 2018 the average number of fire-related yearly casualties is 4. The highest number of injuries - 9 took place in 2003, and the lowest - 0 in 2002. The data has a growing trend.
The average number of injuries per 1,000 fire incidents is 12. This indicator was the highest - 30 in 2018, and the lowest 0 in 2002. The trend for casualties per 1,000 incidents is growing. Compared to the state value the number of casualties per 1,000 fires is about the same.
Based on the data from the years 2002 - 2018 the average number of fire-related yearly casualties is 4. The highest number of injuries - 9 took place in 2003, and the lowest - 0 in 2002. The data has a growing trend.
The average number of injuries per 1,000 fire incidents is 12. This indicator was the highest - 30 in 2018, and the lowest 0 in 2002. The trend for casualties per 1,000 incidents is growing. Compared to the state value the number of casualties per 1,000 fires is about the same.Casualties per 1,000 incidents in Lancaster, OH compared to nearest cities:
(Note: Based on data for all years, including only cities with at least 500 fire incidents)
| Lancaster: | 12.7 |
| Carroll: | 1.3 |
| Amanda: | 0.0 |
| Baltimore: | 1.5 |
| Millersport: | 6.8 |
| Canal Winchester: | 5.9 |
| Pickerington: | 15.8 |
| Thornville: | 4.1 |
| Buckeye Lake: | 2.0 |
 30.7% incidents where reported in the morning and 69.3% in the evening. The most fires (15.4%) took place on Saturday, and the least (13.3%) on Thursday.
 According to the 4,806 incident reports from years 2002 - 2018 most fires (9.7%) took place during June, and the least (6.5%) in September.
 Out of all 22,279 cases reported during the years 2002 - 2018, the most belonged to the categories: Rescue & EMS (35.8%), Fire (21.6%), and Hazardous Condition (17.3%).
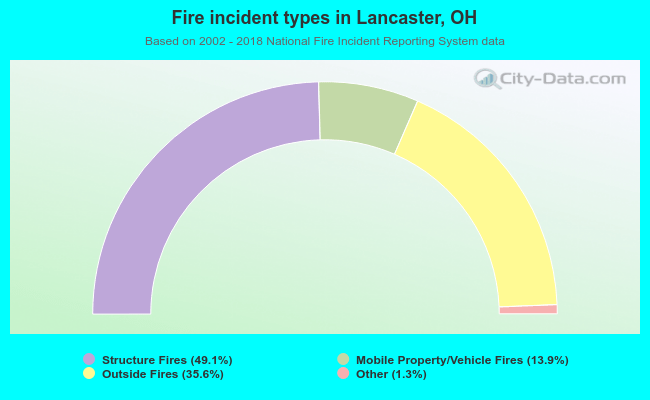 When looking into fire subcategories, the most reports belonged to: Structure Fires (49.1%), and Outside Fires (35.6%).