Leawood: Fire Incidents, Kansas (KS)
Where are fire incidents reported in Leawood, KS
Something went wrong! Please refresh the page.
| Fire incidents reported | |
|---|---|
| Sreet name | Count |
| 119TH ST | 106 |
| MISSION RD | 64 |
| STATE LINE RD | 64 |
| HIGH DR | 62 |
| LEE BLVD | 60 |
| MANOR RD | 60 |
| NALL AVE | 52 |
| 135TH ST | 50 |
| 117TH ST | 48 |
| SAGAMORE RD | 48 |
| 138TH TER | 44 |
| MEADOW LN | 40 |
| ROE AVE | 36 |
| BELINDER RD | 34 |
| TOWN CENTER DR | 32 |
| 95TH ST | 30 |
| OVERBROOK RD | 30 |
| 137TH TER | 28 |
| 143RD ST | 24 |
| CHEROKEE LN | 24 |
| 123RD ST | 22 |
| 127TH ST | 22 |
| MEADOW LANE | 22 |
| MOHAWK RD | 22 |
| 103RD ST | 20 |
| 147TH ST | 18 |
| ASH ST | 18 |
| COLLEGE BLVD | 18 |
| 103RD TER | 16 |
| 111TH TER | 16 |
| Other | 81 |
2002 - 2018 National Fire Incident Reporting System (NFIRS) incidents
- Incident types reported to NFIRS in Leawood, KS
- 8,60349.9%Rescue & EMS
- 2,08012.1%Good Intent Call
- 1,96511.4%Hazardous Condition
- 1,91511.1%False Alarm
- 1,3988.1%Service Call
- 1,2117.0%Fire
- 320.2%Severe Weather
- 310.2%Overpressure Rupture
- Fire incident types reported to NFIRS in Leawood, KS
- 62951.9%Structure Fires
- 43936.3%Outside Fires
- 12510.3%Mobile Property/Vehicle Fires
- 181.5%Other
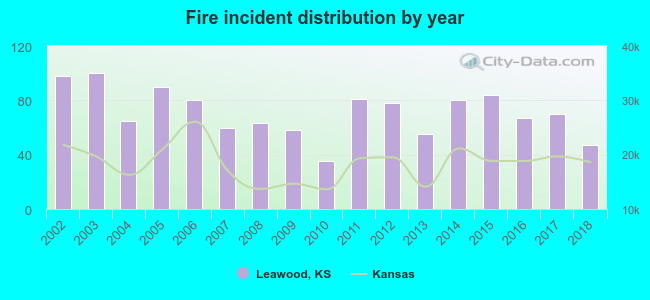 According to the data from the years 2002 - 2018 the average number of fires per year is 71. The highest number of fires - 100 took place in 2003, and the least - 35 in 2010. The data has a declining trend.
The average number of yearly fire incidents per 10k residents in Leawood, KS compared to nearest cities:
(Note: Based on data for the last 3 years, including only cities with population 5,000 and above)
| Leawood: | 17.8 |
| Overland Park: | 21.0 |
| Prairie Village: | 14.3 |
| Mission: | 28.1 |
| Merriam: | 38.7 |
| Roeland Park: | 22.9 |
| Lenexa: | 30.4 |
| Shawnee: | 23.6 |
| Olathe: | 21.1 |
 The median response time based on all reported fire incidents is 5 minutes. This is lower than the Kansas median value.
The median response time in Leawood, KS compared to nearest cities:
(Note: Based on data for all years, including only cities with at least 500 fire incidents)
| Leawood: | 5 minutes |
| Overland Park: | 6 minutes |
| Merriam: | 5 minutes |
| Lenexa: | 5 minutes |
| Shawnee: | 6 minutes |
| Olathe: | 5 minutes |
| Kansas City: | 5 minutes |
| Spring Hill: | 7 minutes |
| Bonner Springs: | 8 minutes |
 Based on the data from the years 2002 - 2018 the average number of fire-related yearly casualties is 1. The highest number of casualties - 4 took place in 2014, and the lowest - 0 in 2004. The data has a dropping trend.
The average number of casualties per 1,000 fire incidents is 7. This indicator was the highest - 50 in 2014, and the lowest 0 in 2004. The trend for injuries per 1,000 fire incidents is dropping. Compared to the state value the number of injuries per 1,000 fire incidents is similar.
Based on the data from the years 2002 - 2018 the average number of fire-related yearly casualties is 1. The highest number of casualties - 4 took place in 2014, and the lowest - 0 in 2004. The data has a dropping trend.
The average number of casualties per 1,000 fire incidents is 7. This indicator was the highest - 50 in 2014, and the lowest 0 in 2004. The trend for injuries per 1,000 fire incidents is dropping. Compared to the state value the number of injuries per 1,000 fire incidents is similar.Casualties per 1,000 incidents in Leawood, KS compared to nearest cities:
(Note: Based on data for all years, including only cities with at least 500 fire incidents)
| Leawood: | 8.3 |
| Overland Park: | 25.7 |
| Merriam: | 9.6 |
| Lenexa: | 17.0 |
| Shawnee: | 18.6 |
| Olathe: | 17.6 |
| Kansas City: | 13.3 |
| Spring Hill: | 14.0 |
| Bonner Springs: | 5.5 |
 31.6% incidents where reported in the morning and 68.4% in the evening. The most fires (16.1%) took place on Wednesday, and the least (13.0%) on Thursday.
 Based on the 1,211 reports from years 2002 - 2018 most fires (12.4%) took place during April, and the least (5.9%) in September.
 Out of all 17,243 cases reported during the years 2002 - 2018, the most belonged to the categories: Rescue & EMS (49.9%), Good Intent Call (12.1%), and Hazardous Condition (11.4%).
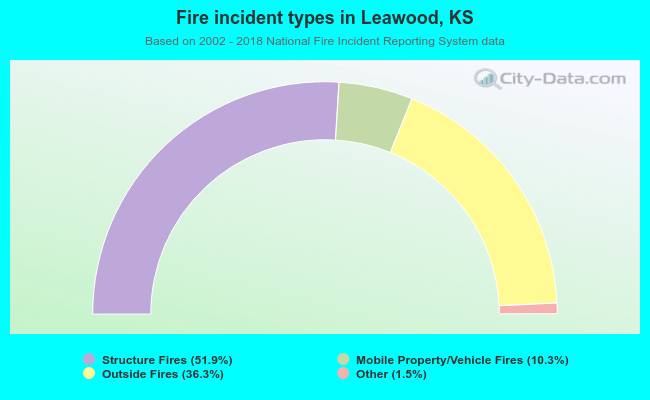 When looking into fire subcategories, the most incidents belonged to: Structure Fires (51.9%), and Outside Fires (36.3%).