Lebo: Fire Incidents, Kansas (KS)
Where are fire incidents reported in Lebo, KS
Something went wrong! Please refresh the page.
|
| |||||||||||||||||||||||||||||||||||||||||||||||||||||||||||||||||||||||||||||||||||||||||||||||||||||||||||||
2002 - 2018 National Fire Incident Reporting System (NFIRS) incidents
- Incident types reported to NFIRS in Lebo, KS
- 57346.0%Rescue & EMS
- 43735.1%Fire
- 1199.6%Hazardous Condition
- 806.4%Good Intent Call
- 221.8%Service Call
- 90.7%False Alarm
- 30.2%Overpressure Rupture
- 20.2%Severe Weather
- Fire incident types reported to NFIRS in Lebo, KS
- 32774.8%Outside Fires
- 5913.5%Mobile Property/Vehicle Fires
- 439.8%Structure Fires
- 81.8%Other
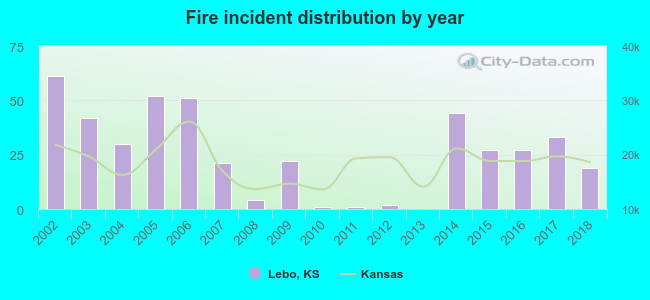 According to the data from the years 2002 - 2018 the average number of fires per year is 26. The highest number of fires - 61 took place in 2002, and the least - 0 in 2013. The data has a declining trend.
 21.1% incidents where reported in the morning and 78.9% in the evening. The most fires (18.8%) took place on Friday, and the least (10.8%) on Monday.
 According to the 437 incident reports from years 2002 - 2018 most fires (27.9%) took place during March, and the least (2.3%) in September.
 Out of all 1,245 cases reported during the years 2002 - 2018, the most belonged to the categories: Rescue & EMS (46.0%), Fire (35.1%), and Hazardous Condition (9.6%).
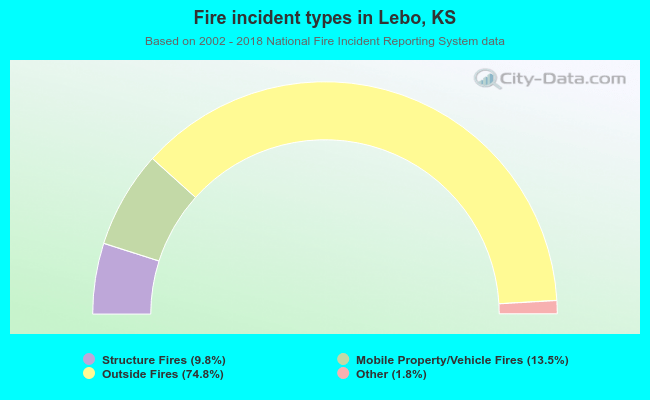 When looking into fire subcategories, the most incidents belonged to: Outside Fires (74.8%), and Mobile Property/Vehicle Fires (13.5%).