Lempster: Fire Incidents, New Hampshire (NH)
Where are fire incidents reported in Lempster, NH
Something went wrong! Please refresh the page.
|
| |||||||||||||||||||||||||||||||||||||||||||||||||||||||||||||||||||||||||||||||||||||||||||||||||||||||||||||
2003 - 2018 National Fire Incident Reporting System (NFIRS) incidents
- Incident types reported to NFIRS in Lempster, NH
- 26646.0%Rescue & EMS
- 11620.1%Fire
- 10918.9%Hazardous Condition
- 325.5%Service Call
- 315.4%Good Intent Call
- 193.3%False Alarm
- 30.5%Severe Weather
- 10.2%Overpressure Rupture
- 10.2%Special Incident
- Fire incident types reported to NFIRS in Lempster, NH
- 7161.2%Structure Fires
- 3227.6%Outside Fires
- 108.6%Mobile Property/Vehicle Fires
- 32.6%Other
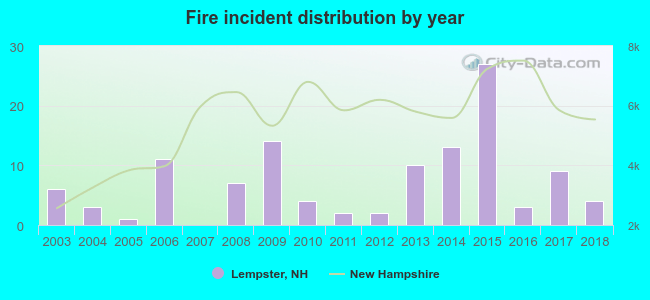 Based on the data from the years 2003 - 2018 the average number of fire incidents per year is 7. The highest number of reported fire incidents - 27 took place in 2015, and the least - 0 in 2007. The data has a dropping trend.
 31.0% incidents where reported in the morning and 69.0% in the evening. The most fires (19.8%) took place on Thursday, and the least (7.8%) on Friday.
 Based on the 116 fire incident reports from years 2003 - 2018 most fires (19.8%) took place during May, and the least (2.6%) in August.
 Out of all 578 cases reported during the years 2003 - 2018, the most belonged to the categories: Rescue & EMS (46.0%), Fire (20.1%), and Hazardous Condition (18.9%).
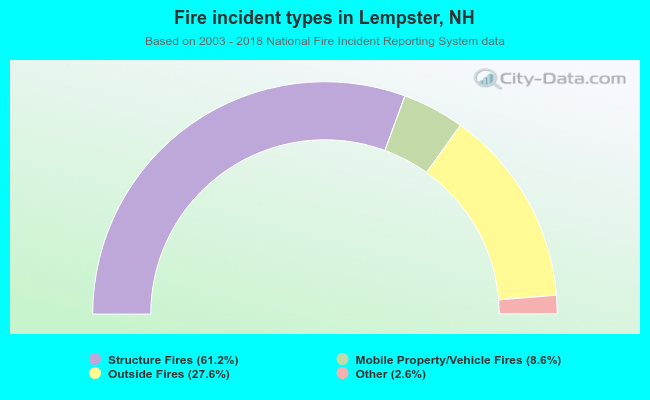 When looking into fire subcategories, the most reports belonged to: Structure Fires (61.2%), and Outside Fires (27.6%).