Los Gatos: Fire Incidents, California (CA)
Where are fire incidents reported in Los Gatos, CA
Something went wrong! Please refresh the page.
| Fire incidents reported | |
|---|---|
| Sreet name | Count |
| HY 17 | 320 |
| SANTA CRUZ AV | 84 |
| ORMSBY TRL | 74 |
| BLOSSOM HILL RD | 54 |
| MAIN ST | 52 |
| BEAR CREEK RD | 50 |
| LOS GATOS BL | 50 |
| MAYMENS FLAT | 50 |
| SUMMIT RD | 50 |
| LOS GATOS | 44 |
| STREET | 40 |
| RUSSELL RIDGE | 38 |
| HIGHWAY | 34 |
| UNIVERSITY AV | 34 |
| HIGHLAND WAY | 30 |
| OKA RD | 28 |
| FY 17 | 24 |
| HIGH SCHOOL CT | 22 |
| SUMMIT | 22 |
| ALMA BRIDGE RD | 20 |
| FY 85 | 20 |
| HY 9 | 20 |
| LOMA CHIQUITA RD | 18 |
| MADRONE DR | 18 |
| PARR AV | 18 |
| CHURCH ST | 16 |
| SHANNON RD | 16 |
| BLACK RD | 14 |
| LARK AV | 14 |
| MORE AV | 14 |
| Other | 35 |
2005 - 2018 National Fire Incident Reporting System (NFIRS) incidents
- Incident types reported to NFIRS in Los Gatos, CA
- 10,02455.8%Rescue & EMS
- 2,69915.0%Good Intent Call
- 1,5848.8%Hazardous Condition
- 1,3237.4%Fire
- 1,2246.8%Service Call
- 1,0355.8%False Alarm
- 360.2%Overpressure Rupture
- Fire incident types reported to NFIRS in Los Gatos, CA
- 49437.3%Outside Fires
- 40730.8%Structure Fires
- 33725.5%Mobile Property/Vehicle Fires
- 856.4%Other
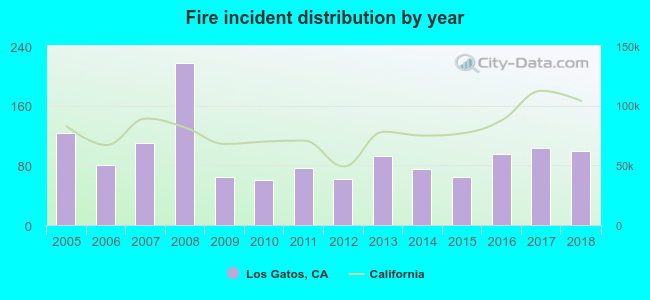 According to the data from the years 2005 - 2018 the average number of fire incidents per year is 95. The highest number of fires - 217 took place in 2008, and the least - 60 in 2010. The data has a dropping trend.
The average number of yearly fire incidents per 10k residents in Los Gatos, CA compared to nearest cities:
(Note: Based on data for the last 3 years, including only cities with population 5,000 and above)
| Los Gatos: | 32.2 |
| Campbell: | 20.7 |
| Saratoga: | 8.6 |
| San Jose: | 15.6 |
| Cupertino: | 13.1 |
| Santa Clara: | 1.8 |
| Sunnyvale: | 9.6 |
| Los Altos: | 11.9 |
| Ben Lomond: | 30.5 |
 The median response time based on all reported fire incidents is 6 minutes. This is comparable to the California median value.
The median response time in Los Gatos, CA compared to nearest cities:
(Note: Based on data for all years, including only cities with at least 500 fire incidents)
| Los Gatos: | 6 minutes |
| Campbell: | 5 minutes |
| San Jose: | 6 minutes |
| Cupertino: | 5 minutes |
| Sunnyvale: | 5 minutes |
| Mountain View: | 5 minutes |
| Scotts Valley: | 7 minutes |
| Milpitas: | 5 minutes |
| Palo Alto: | 6 minutes |
 According to the reports from the years 2005 - 2018 the average number of fire-related yearly deaths is 0. The highest number of deaths - 1 took place in 2008, and the lowest - 0 in 2005. The data has a constant trend.
 According to the data from the years 2005 - 2018 the average number of fire-related casualties per year is 2. The highest number of casualties - 4 took place in 2005, and the lowest - 0 in 2011. The data has a constant trend.
The average number of casualties per 1,000 fire incidents is 20. This indicator was the highest - 42 in 2016, and the lowest 0 in 2011. The trend for injuries per 1,000 fires is increasing. Compared to the California value the number of injuries per 1,000 fires is much higher.
According to the data from the years 2005 - 2018 the average number of fire-related casualties per year is 2. The highest number of casualties - 4 took place in 2005, and the lowest - 0 in 2011. The data has a constant trend.
The average number of casualties per 1,000 fire incidents is 20. This indicator was the highest - 42 in 2016, and the lowest 0 in 2011. The trend for injuries per 1,000 fires is increasing. Compared to the California value the number of injuries per 1,000 fires is much higher.Casualties per 1,000 incidents in Los Gatos, CA compared to nearest cities:
(Note: Based on data for all years, including only cities with at least 500 fire incidents)
| Los Gatos: | 19.7 |
| Campbell: | 24.7 |
| San Jose: | 8.7 |
| Cupertino: | 13.3 |
| Sunnyvale: | 18.3 |
| Mountain View: | 4.7 |
| Scotts Valley: | 7.0 |
| Milpitas: | 5.1 |
| Palo Alto: | 3.0 |
 37.8% incidents where reported in the morning and 62.2% in the evening. The most fires (21.7%) took place on Thursday, and the least (11.9%) on Tuesday.
 According to the 1,323 reports from years 2005 - 2018 most fires (16.6%) took place during May, and the least (5.5%) in March.
 Out of all 17,951 cases reported during the years 2005 - 2018, the most belonged to the categories: Rescue & EMS (55.8%), Good Intent Call (15.0%), and Hazardous Condition (8.8%).
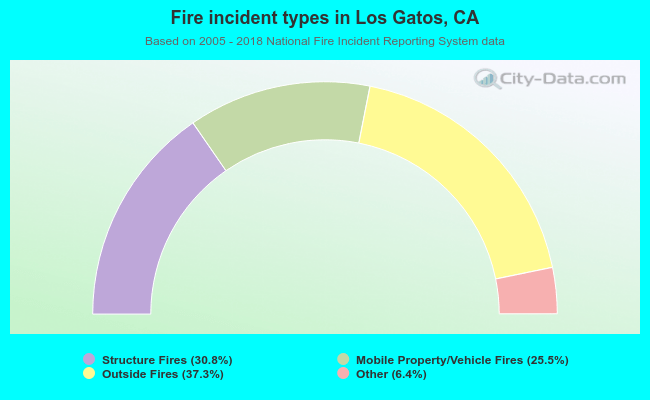 When looking into fire subcategories, the most reports belonged to: Outside Fires (37.3%), and Structure Fires (30.8%).