Louisville: Fire Incidents, Kansas (KS)
Where are fire incidents reported in Louisville, KS
Something went wrong! Please refresh the page.
|
| |||||||||||||||||||||||||||||||||||||||||||||||||||||||||||||||||||||||||||||||||||||||||||||
2002 - 2018 National Fire Incident Reporting System (NFIRS) incidents
- Incident types reported to NFIRS in Louisville, KS
- 10158.0%Fire
- 2413.8%Rescue & EMS
- 1910.9%Hazardous Condition
- 169.2%Severe Weather
- 95.2%Good Intent Call
- 21.1%False Alarm
- 21.1%Special Incident
- 10.6%Service Call
- Fire incident types reported to NFIRS in Louisville, KS
- 7271.3%Outside Fires
- 2120.8%Structure Fires
- 55.0%Other
- 33.0%Mobile Property/Vehicle Fires
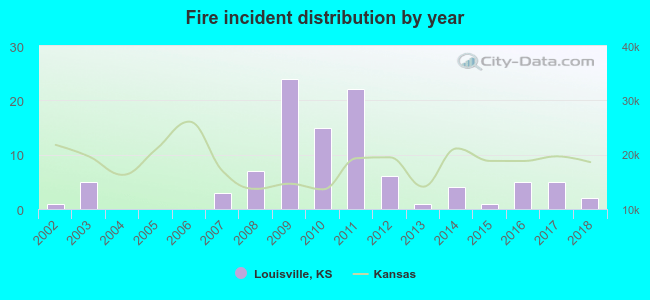 According to the data from the years 2002 - 2018 the average number of fires per year is 6. The highest number of fires - 24 took place in 2009, and the least - 0 in 2004. The data has a rising trend.
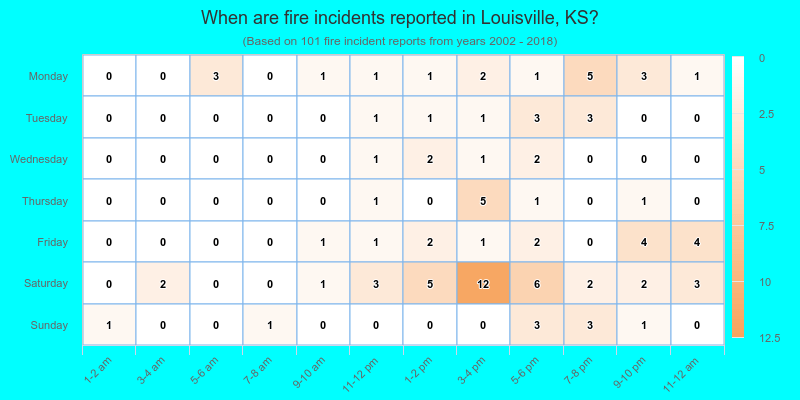
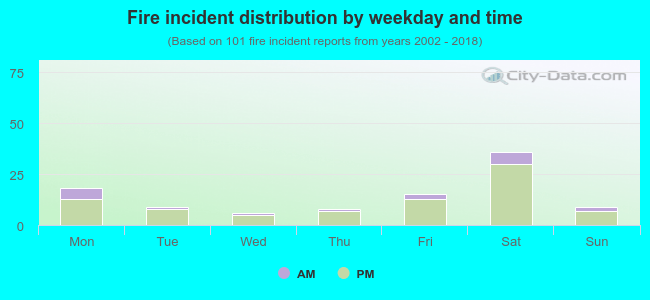 17.8% incidents where reported in the morning and 82.2% in the evening. The most fires (35.6%) took place on Saturday, and the least (5.9%) on Wednesday.
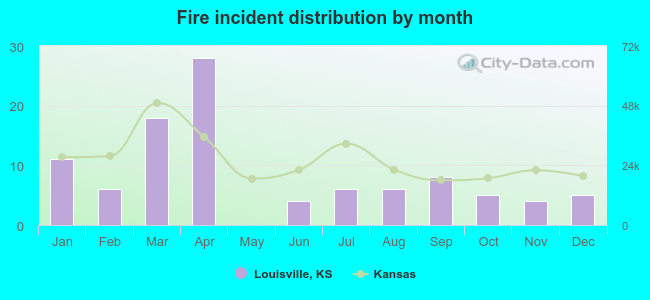 Based on the 101 incident reports from years 2002 - 2018 most fires (27.7%) took place during April, and the least (0.0%) in May.
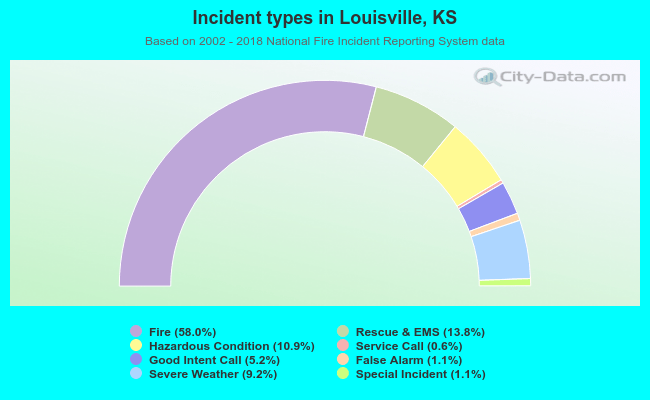 Out of all 174 cases reported during the years 2002 - 2018, the most belonged to the categories: Fire (58.0%), Overpressure Rupture (13.8%), and Rescue & EMS (10.9%).
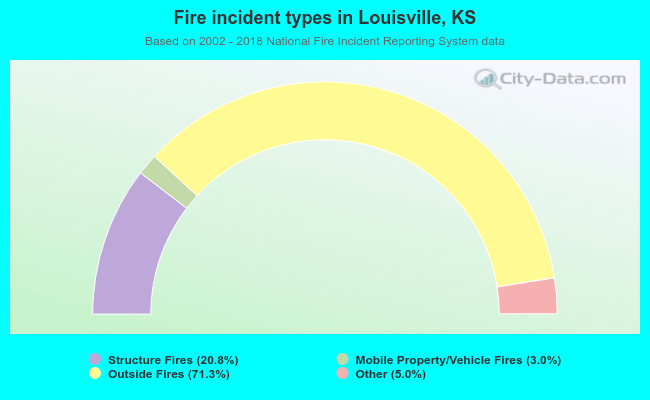 When looking into fire subcategories, the most reports belonged to: Outside Fires (71.3%), and Structure Fires (20.8%).