Lovell: Fire Incidents, Wyoming (WY)
Where are fire incidents reported in Lovell, WY
Something went wrong! Please refresh the page.
|
| |||||||||||||||||||||||||||||||||||||||||||||||||||||||||||||||||||||||||||||||||||||||||||||||||||||||||||||
| Other | 329 | |||||||||||||||||||||||||||||||||||||||||||||||||||||||||||||||||||||||||||||||||||||||||||||||||||||||||||||
2002 - 2018 National Fire Incident Reporting System (NFIRS) incidents
- Incident types reported to NFIRS in Lovell, WY
- 58165.4%Fire
- 11713.2%Hazardous Condition
- 11212.6%Rescue & EMS
- 242.7%False Alarm
- 192.1%Good Intent Call
- 171.9%Overpressure Rupture
- 121.3%Service Call
- 60.7%Special Incident
- 10.1%Severe Weather
- Fire incident types reported to NFIRS in Lovell, WY
- 39067.1%Outside Fires
- 9616.5%Structure Fires
- 5910.2%Mobile Property/Vehicle Fires
- 366.2%Other
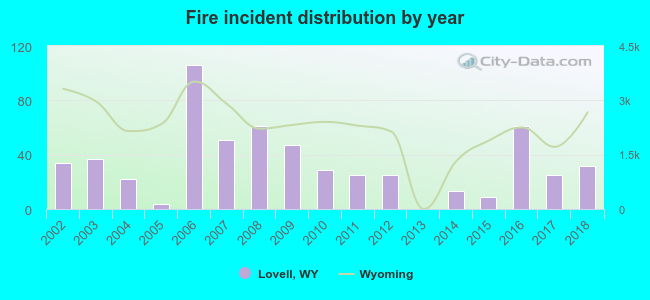 According to the data from the years 2002 - 2018 the average number of fire incidents per year is 34. The highest number of reported fire incidents - 106 took place in 2006, and the least - 0 in 2013. The data has a dropping trend.
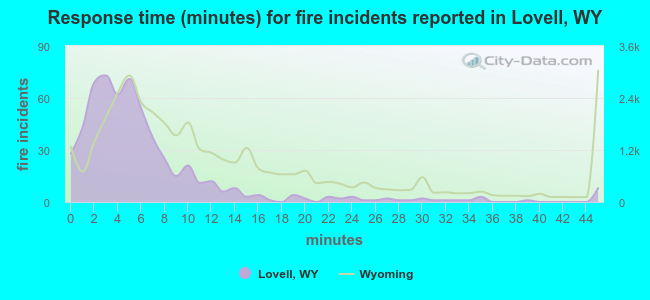 The median response time based on all reported fire incidents is 5 minutes. This is much lower compared to the state median value.
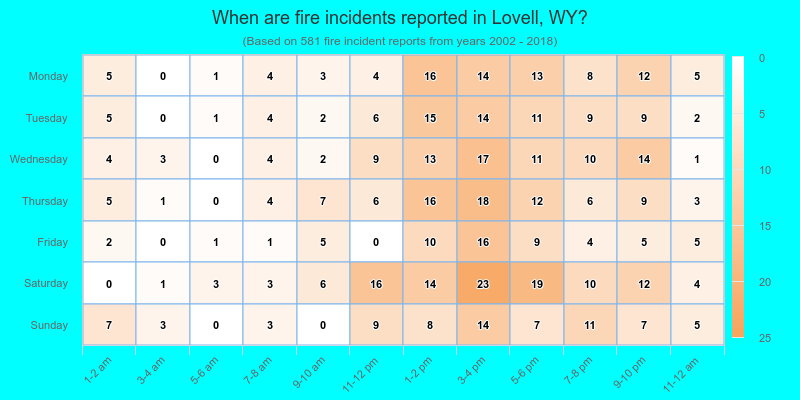
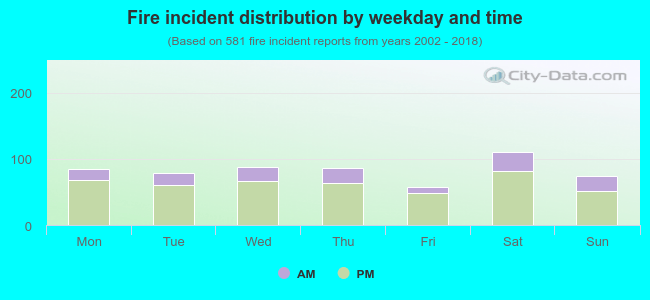 24.1% incidents where reported in the morning and 75.9% in the evening. The most fires (19.1%) took place on Saturday, and the least (10.0%) on Friday.
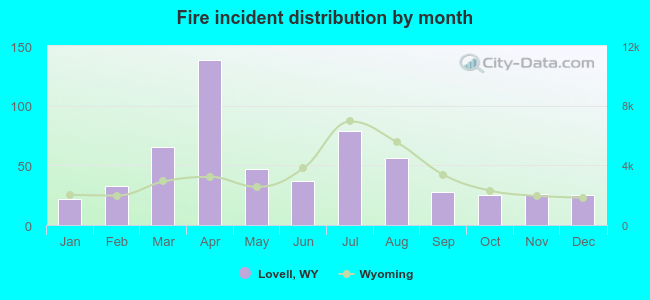 Based on the 581 fire incident reports from years 2002 - 2018 most fires (23.8%) took place during April, and the least (3.8%) in January.
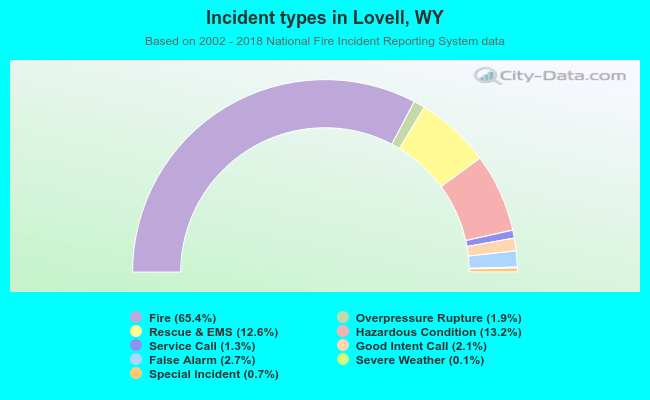 Out of all 889 cases reported during the years 2002 - 2018, the most belonged to the categories: Fire (65.4%), Hazardous Condition (13.2%), and Rescue & EMS (12.6%).
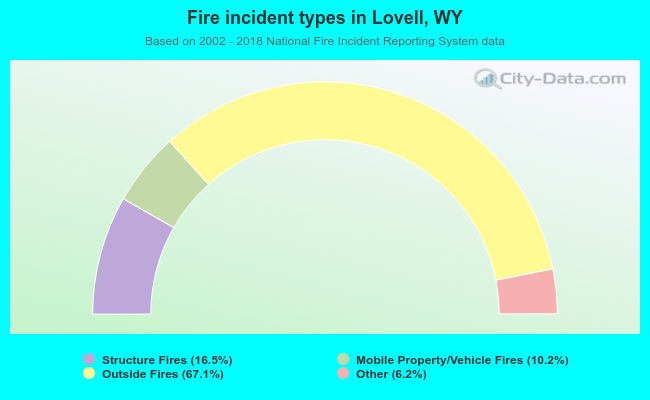 When looking into fire subcategories, the most reports belonged to: Outside Fires (67.1%), and Structure Fires (16.5%).