Lowell: Fire Incidents, Massachusetts (MA)
Where are fire incidents reported in Lowell, MA
Something went wrong! Please refresh the page.
| Fire incidents reported | |
|---|---|
| Sreet name | Count |
| MERRIMACK ST | 456 |
| MIDDLESEX ST | 452 |
| BROADWAY ST | 350 |
| BRIDGE ST | 282 |
| WESTFORD ST | 280 |
| PAWTUCKET ST | 250 |
| PAWTUCKET BLVD | 244 |
| MARKET ST | 232 |
| RIVER PL | 208 |
| GORHAM ST | 194 |
| HILDRETH ST | 190 |
| CHELMSFORD ST | 166 |
| WILDER ST | 164 |
| AIKEN AVE | 148 |
| LAKEVIEW AVE | 142 |
| VARNUM AVE | 140 |
| ROGERS ST | 128 |
| PRINCETON BLVD | 110 |
| LAWRENCE ST | 106 |
| AIKEN ST | 100 |
| MOODY ST | 98 |
| DUTTON ST | 94 |
| APPLETON ST | 92 |
| MEADOW LN | 90 |
| PINE ST | 90 |
| HIGH ST | 88 |
| ADAMS ST | 86 |
| UNIVERSITY AVE | 86 |
| FLETCHER ST | 80 |
| WALKER ST | 80 |
| Other | 676 |
2002 - 2018 National Fire Incident Reporting System (NFIRS) incidents
- Incident types reported to NFIRS in Lowell, MA
- 39,74254.2%Rescue & EMS
- 10,41414.2%False Alarm
- 7,1349.7%Hazardous Condition
- 6,3238.6%Service Call
- 5,9028.1%Fire
- 3,1904.4%Good Intent Call
- 3350.5%Special Incident
- 2020.3%Severe Weather
- Fire incident types reported to NFIRS in Lowell, MA
- 3,73863.3%Structure Fires
- 1,55626.4%Outside Fires
- 5088.6%Mobile Property/Vehicle Fires
- 1001.7%Other
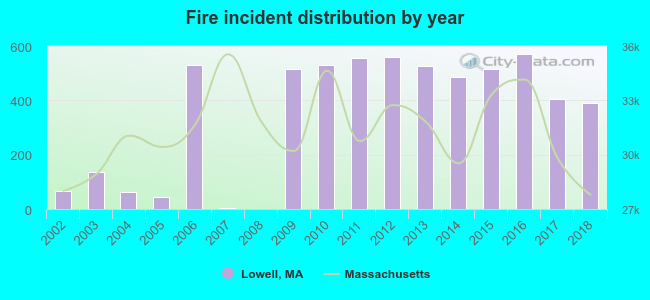 According to the data from the years 2002 - 2018 the average number of fire incidents per year is 347. The highest number of fire incidents - 570 took place in 2016, and the least - 0 in 2008. The data has an increasing trend.
The average number of yearly fire incidents per 10k residents in Lowell, MA compared to nearest cities:
(Note: Based on data for the last 3 years, including only cities with population 5,000 and above)
| Lowell: | 41.4 |
| Dracut: | 20.3 |
| Chelmsford: | 12.3 |
| Tewksbury: | 29.8 |
| Tyngsborough: | 24.5 |
| Billerica: | 27.3 |
| Westford: | 26.0 |
| Lawrence: | 26.0 |
| Andover: | 113.4 |
 The median response time based on all reported fire incidents is 3 minutes. This is lower than the Massachusetts median value.
The median response time in Lowell, MA compared to nearest cities:
(Note: Based on data for all years, including only cities with at least 500 fire incidents)
| Lowell: | 3 minutes |
| Dracut: | 5 minutes |
| Chelmsford: | 5 minutes |
| Tewksbury: | 4 minutes |
| Billerica: | 4 minutes |
| Westford: | 6 minutes |
| Lawrence: | 3 minutes |
| Andover: | 6 minutes |
| Wilmington: | 6 minutes |
 Based on the data from the years 2002 - 2018 the average number of fire-related fatalities per year is 1. The highest number of deaths - 8 took place in 2014, and the lowest - 0 in 2002. The data has an increasing trend.
The average number of fatalities per 1,000 fire incidents is 5. This indicator was the highest - 33 in 2004, and the lowest 0 in 2002. The trend for deaths per 1,000 incidents is growing. Compared to the Massachusetts value the number of deaths per 1,000 fires is much higher.
Based on the data from the years 2002 - 2018 the average number of fire-related fatalities per year is 1. The highest number of deaths - 8 took place in 2014, and the lowest - 0 in 2002. The data has an increasing trend.
The average number of fatalities per 1,000 fire incidents is 5. This indicator was the highest - 33 in 2004, and the lowest 0 in 2002. The trend for deaths per 1,000 incidents is growing. Compared to the Massachusetts value the number of deaths per 1,000 fires is much higher.
 According to the data from the years 2002 - 2018 the average number of fire-related yearly casualties is 2. The highest number of injuries - 6 took place in 2003, and the lowest - 0 in 2004. The data has a dropping trend.
The average number of injuries per 1,000 fires is 12. This indicator was the highest - 70 in 2005, and the lowest 0 in 2004. The trend for casualties per 1,000 fires is decreasing. Compared to the state value the number of injuries per 1,000 incidents is lower.
According to the data from the years 2002 - 2018 the average number of fire-related yearly casualties is 2. The highest number of injuries - 6 took place in 2003, and the lowest - 0 in 2004. The data has a dropping trend.
The average number of injuries per 1,000 fires is 12. This indicator was the highest - 70 in 2005, and the lowest 0 in 2004. The trend for casualties per 1,000 fires is decreasing. Compared to the state value the number of injuries per 1,000 incidents is lower.Casualties per 1,000 incidents in Lowell, MA compared to nearest cities:
(Note: Based on data for all years, including only cities with at least 500 fire incidents)
| Lowell: | 5.6 |
| Dracut: | 10.9 |
| Chelmsford: | 20.9 |
| Tewksbury: | 3.2 |
| Billerica: | 11.1 |
| Westford: | 10.3 |
| Lawrence: | 9.8 |
| Andover: | 1.0 |
| Wilmington: | 10.0 |
 30.7% incidents where reported in the morning and 69.3% in the evening. The most fires (16.4%) took place on Saturday, and the least (12.7%) on Thursday.
 According to the 5,902 reports from years 2002 - 2018 most fires (11.6%) took place during April, and the least (6.9%) in January.
 Out of all 73,302 cases reported during the years 2002 - 2018, the most belonged to the categories: Rescue & EMS (54.2%), False Alarm (14.2%), and Hazardous Condition (9.7%).
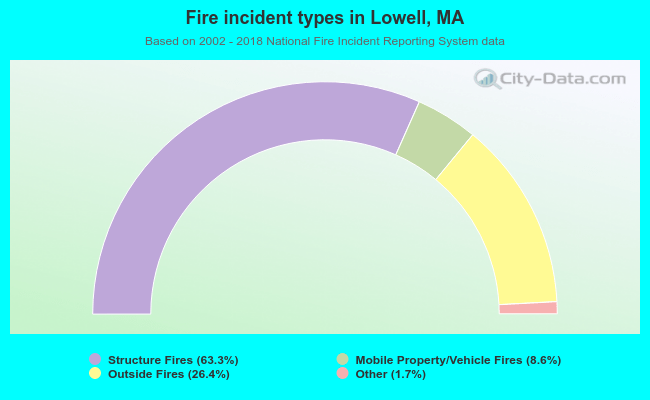 When looking into fire subcategories, the most incidents belonged to: Structure Fires (63.3%), and Outside Fires (26.4%).