| Fire incidents reported |
|---|
| Sreet name | Count |
|---|
| RIVER RD | 12 | | LUNENBURG RD | 10 | | MAIN ST. | 8 | | POND HILL RD | 8 | | BAPTIST HILL RD | 6 | | POND HILL RD | 6 | | 80 DONYO RD | 4 | | COLBY ROAD RD | 4 | | DANCE HALL RD | 4 | | DANCE HALL ROAD RD | 4 | | RIVER ROAD RD | 4 | | SUNRISE ACRES | 4 | | WEST LUNENBURG RD | 4 | | WEST MAIN STREET HWY | 4 | | 102 RT | 2 | | 1697 WEST LUNENBURG RD | 2 | | 2000 WEST LUNENBURG RD | 2 | | 2000 WEST MAIN ST | 2 | | 245 COMMERCIAL AVE | 2 | | 388 GUILDHALL HILL RD | 2 | | 507 LANCASTER RD | 2 | | 65 CHURCH ST | 2 | | 98 MALLIET RD | 2 | | BAPIST HILL RD | 2 | | BAPTIST HILL | 2 |
| | | Fire incidents reported |
|---|
| Sreet name | Count |
|---|
| BAPTIST HILL RD. | 2 | | BAPTIST HILL ROAD | 2 | | BEECH ST | 2 | | BOBBIN MILL ROAD RD | 2 | | CARR BROOK LN LOT 61 | 2 | | COLE HILL RD | 2 | | COMMERCIAL AVE | 2 | | DANCE HALL RD | 2 | | FOURNIER RD | 2 | | FRENCH RD | 2 | | GUILDHALL HILL RD | 2 | | HASTINGS RD | 2 | | KIMBALL HILL | 2 | | KIMBALL RD | 2 | | KIMBALL ROAD | 2 | | MAILETT ROAD | 2 | | MAILLETT ROAD | 2 | | MAIN ST | 2 | | MAIN STREET | 2 | | MAIN STREET HWY | 2 | | MALLETT ROAD RD | 2 | | MITCHELL RD, CONCORD | 2 | | MT. PROSPECT RD | 2 | | OREGON RD | 2 | | POND HILL | 2 |
|
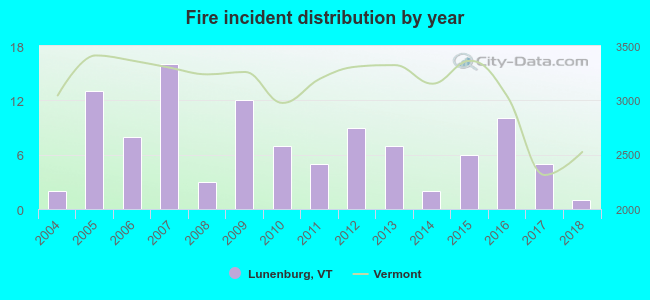 According to the data from the years 2004 - 2018 the average number of fires per year is 7. The highest number of reported fires - 16 took place in 2007, and the least - 1 in 2018. The data has a decreasing trend.
 41.5% incidents where reported in the morning and 58.5% in the evening. The most fires (19.8%) took place on Saturday, and the least (8.5%) on Sunday.
 Based on the 106 fire incidents from years 2004 - 2018 most fires (19.8%) took place during April, and the least (3.8%) in March.
 Out of all 166 cases reported during the years 2004 - 2018, the most belonged to the categories: Fire (63.9%), Rescue & EMS (24.7%), and Hazardous Condition (4.8%).
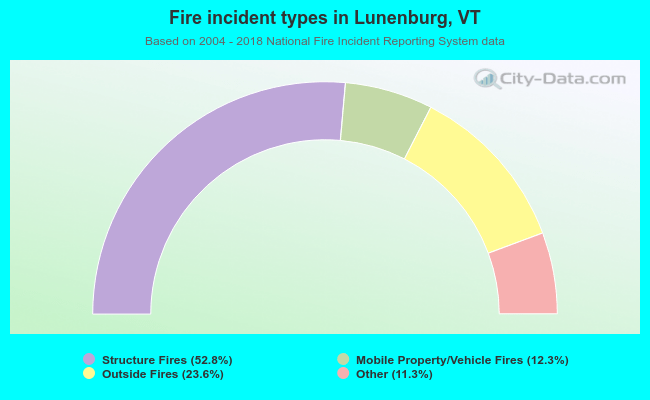 When looking into fire subcategories, the most incidents belonged to: Structure Fires (52.8%), and Outside Fires (23.6%).