Manila: Fire Incidents, California (CA)
Where are fire incidents reported in Manila, CA
Something went wrong! Please refresh the page.
|
| |||||||||||||||||||||||||||||||||||||||||||||||||||||||||||||||||||||||||||||||||||||||||||||||||
2005 - 2018 National Fire Incident Reporting System (NFIRS) incidents
- Incident types reported to NFIRS in Manila, CA
- 11443.3%Fire
- 7930.0%Rescue & EMS
- 4216.0%Good Intent Call
- 186.8%Service Call
- 83.0%Hazardous Condition
- 20.8%False Alarm
- Fire incident types reported to NFIRS in Manila, CA
- 6052.6%Outside Fires
- 3833.3%Structure Fires
- 1412.3%Mobile Property/Vehicle Fires
- 21.8%Other
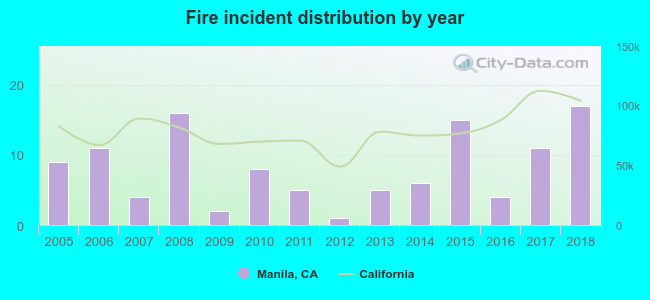 Based on the data from the years 2005 - 2018 the average number of fires per year is 8. The highest number of fire incidents - 17 took place in 2018, and the least - 1 in 2012. The data has an increasing trend.
 Based on the reports from the years 2005 - 2018 the average number of fire-related yearly casualties is 1. The highest number of reported injuries - 4 took place in 2008, and the lowest - 0 in 2005. The data has a constant trend.
 36.0% incidents where reported in the morning and 64.0% in the evening. The most fires (21.1%) took place on Wednesday, and the least (7.0%) on Monday.
 According to the 114 fire incidents from years 2005 - 2018 most fires (19.3%) took place during July, and the least (0.9%) in January.
 Out of all 263 cases reported during the years 2005 - 2018, the most belonged to the categories: Fire (43.3%), Overpressure Rupture (30.0%), and Service Call (16.0%).
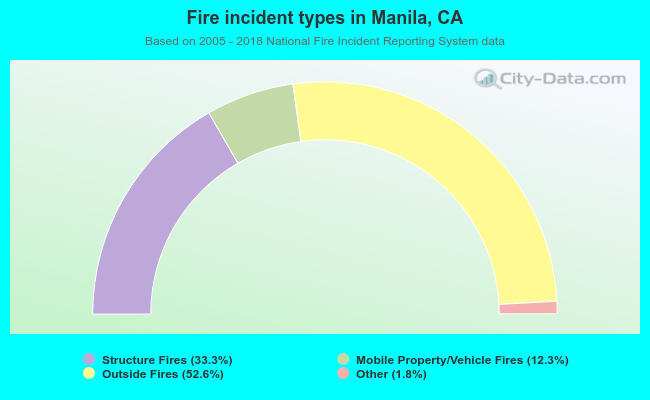 When looking into fire subcategories, the most reports belonged to: Outside Fires (52.6%), and Structure Fires (33.3%).