Manteca: Fire Incidents, California (CA)
Where are fire incidents reported in Manteca, CA
Something went wrong! Please refresh the page.
| Fire incidents reported | |
|---|---|
| Sreet name | Count |
| YOSEMITE AVE | 688 |
| MAIN ST | 432 |
| UNION RD | 302 |
| AIRPORT WAY | 276 |
| LOUISE AVE | 196 |
| CENTER ST | 172 |
| MOFFAT BLVD | 170 |
| WOODWARD AVE | 170 |
| AUSTIN RD | 166 |
| LATHROP RD | 98 |
| NORTHGATE DR | 96 |
| HWY 99 | 90 |
| ALAMEDA ST | 76 |
| LINCOLN AVE | 72 |
| NORTH ST | 70 |
| FISHBACK RD | 62 |
| HWY. 99 | 62 |
| EDISON ST | 56 |
| WILLIAMSON RD | 56 |
| GRANT AVE | 54 |
| ATHERTON DR | 52 |
| FRENCH CAMP RD | 52 |
| BUTTON AVE | 48 |
| WAWONA ST | 46 |
| DANIELS ST | 44 |
| MISSION RIDGE DR | 42 |
| SPRECKELS AVE | 40 |
| CRESTWOOD AVE | 38 |
| HOYT LN | 36 |
| HWY 120 | 36 |
| Other | 711 |
2002 - 2018 National Fire Incident Reporting System (NFIRS) incidents
- Incident types reported to NFIRS in Manteca, CA
- 17,23050.5%Rescue & EMS
- 6,42818.8%Good Intent Call
- 4,50913.2%Fire
- 2,9018.5%Service Call
- 1,6164.7%Hazardous Condition
- 1,3884.1%False Alarm
- Fire incident types reported to NFIRS in Manteca, CA
- 2,35952.3%Outside Fires
- 1,27228.2%Structure Fires
- 80717.9%Mobile Property/Vehicle Fires
- 711.6%Other
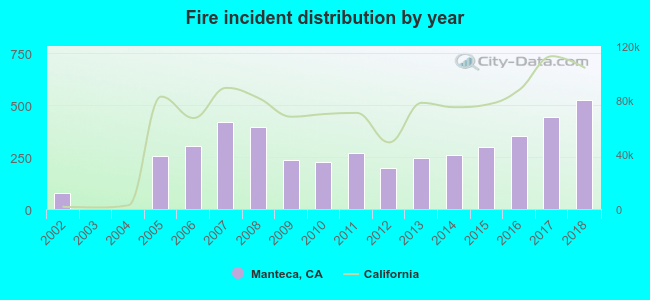 Based on the data from the years 2002 - 2018 the average number of fires per year is 265. The highest number of fire incidents - 524 took place in 2018, and the least - 0 in 2003. The data has an increasing trend.
The average number of yearly fire incidents per 10k residents in Manteca, CA compared to nearest cities:
(Note: Based on data for the last 3 years, including only cities with population 5,000 and above)
| Manteca: | 59.8 |
| Lathrop: | 70.6 |
| Ripon: | 46.5 |
| Salida: | 6.6 |
| Escalon: | 70.4 |
| Tracy: | 35.8 |
| Stockton: | 104.6 |
| Modesto: | 68.9 |
| Riverbank: | 32.8 |
 The median response time based on all reported fire incidents is 5 minutes. This is lower compared to the California median value.
The median response time in Manteca, CA compared to nearest cities:
(Note: Based on data for all years, including only cities with at least 500 fire incidents)
| Manteca: | 5 minutes |
| Lathrop: | 6 minutes |
| Ripon: | 6 minutes |
| Tracy: | 7 minutes |
| Stockton: | 5 minutes |
| Modesto: | 5 minutes |
| Riverbank: | 6 minutes |
| Linden: | 8 minutes |
| Oakdale: | 6 minutes |
 According to the data from the years 2002 - 2018 the average number of fire-related casualties per year is 2. The highest number of injuries - 7 took place in 2006, and the lowest - 0 in 2002. The data has an increasing trend.
The average number of casualties per 1,000 fire incidents is 7. This indicator was the highest - 23 in 2006, and the lowest 0 in 2002. The trend for casualties per 1,000 fires is growing. Compared to the state value the number of casualties per 1,000 incidents is higher.
According to the data from the years 2002 - 2018 the average number of fire-related casualties per year is 2. The highest number of injuries - 7 took place in 2006, and the lowest - 0 in 2002. The data has an increasing trend.
The average number of casualties per 1,000 fire incidents is 7. This indicator was the highest - 23 in 2006, and the lowest 0 in 2002. The trend for casualties per 1,000 fires is growing. Compared to the state value the number of casualties per 1,000 incidents is higher.
 35.4% incidents where reported in the morning and 64.6% in the evening. The most fires (15.4%) took place on Tuesday, and the least (13.3%) on Monday.
 Based on the 4,509 incident reports from years 2002 - 2018 most fires (14.5%) took place during July, and the least (5.8%) in October.
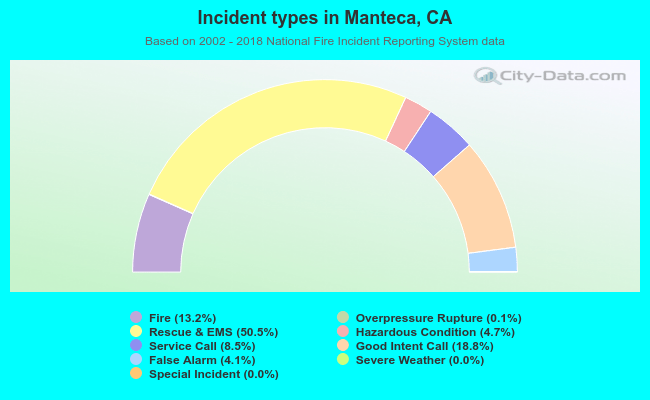 Out of all 34,108 cases reported during the years 2002 - 2018, the most belonged to the categories: Rescue & EMS (50.5%), Good Intent Call (18.8%), and Fire (13.2%).
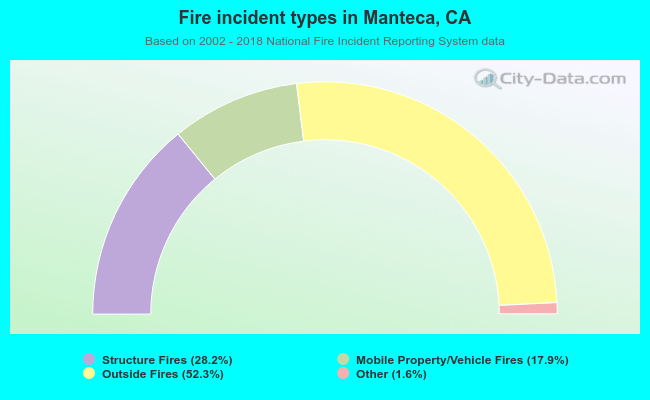 When looking into fire subcategories, the most reports belonged to: Outside Fires (52.3%), and Structure Fires (28.2%).