Marietta: Fire Incidents, Georgia (GA)
Where are fire incidents reported in Marietta, GA
Something went wrong! Please refresh the page.
| Fire incidents reported | |
|---|---|
| Sreet name | Count |
| ROSWELL RD | 512 |
| WINDY HILL RD | 356 |
| FRANKLIN RD | 342 |
| POWERS FERRY RD | 320 |
| AUSTELL RD | 314 |
| DELK RD | 276 |
| CANTON RD | 248 |
| COBB DR | 202 |
| SANDY PLAINS RD | 202 |
| COBB PKWY | 188 |
| JOHNSON FERRY RD | 180 |
| TERRELL MILL RD | 174 |
| POWDER SPRINGS ST | 168 |
| POWDER SPRINGS RD | 134 |
| LOWER ROSWELL RD | 130 |
| I75 EXPY | 120 |
| BELLS FERRY RD | 116 |
| SHALLOWFORD RD | 116 |
| WILLIAMS DR | 112 |
| ERNEST BARRETT PKWY | 106 |
| SANDTOWN RD | 106 |
| WHITLOCK AVE | 106 |
| FAVOR RD | 102 |
| ATLANTA RD | 100 |
| COBB | 98 |
| DALLAS HWY | 96 |
| WINDCLIFF DR | 96 |
| HIDDEN GLEN DR | 94 |
| BENTLEY RD | 88 |
| PAT MELL RD | 74 |
| Other | 3,312 |
2002 - 2018 National Fire Incident Reporting System (NFIRS) incidents
- Incident types reported to NFIRS in Marietta, GA
- 65,92546.7%Rescue & EMS
- 29,37720.8%Good Intent Call
- 16,99912.0%Service Call
- 12,4668.8%Hazardous Condition
- 8,5886.1%Fire
- 7,5805.4%False Alarm
- Fire incident types reported to NFIRS in Marietta, GA
- 3,48440.6%Structure Fires
- 3,38239.4%Outside Fires
- 1,66019.3%Mobile Property/Vehicle Fires
- 620.7%Other
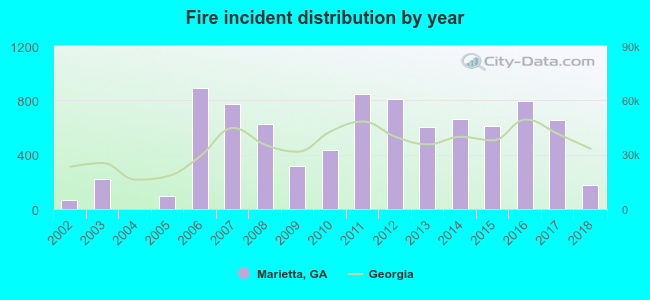 Based on the data from the years 2002 - 2018 the average number of fire incidents per year is 505. The highest number of reported fires - 894 took place in 2006, and the least - 2 in 2004. The data has an increasing trend.
The average number of yearly fire incidents per 10k residents in Marietta, GA compared to nearest cities:
(Note: Based on data for the last 3 years, including only cities with population 5,000 and above)
| Marietta: | 90.3 |
| Smyrna: | 30.3 |
| Kennesaw: | 49.7 |
| Mableton: | 20.4 |
| Sandy Springs: | 20.1 |
| Powder Springs: | 65.1 |
| Woodstock: | 75.2 |
| Acworth: | 85.7 |
| Austell: | 196.1 |
 The median response time based on all reported fire incidents is 6 minutes. This is close to the state median value.
The median response time in Marietta, GA compared to nearest cities:
(Note: Based on data for all years, including only cities with at least 500 fire incidents)
| Marietta: | 6 minutes |
| Smyrna: | 5 minutes |
| Kennesaw: | 6 minutes |
| Mableton: | 6 minutes |
| Sandy Springs: | 6 minutes |
| Powder Springs: | 6 minutes |
| Woodstock: | 7 minutes |
| Acworth: | 7 minutes |
| Austell: | 5 minutes |
 According to the reports from the years 2002 - 2018 the average number of fire-related fatalities per year is 1. The highest number of reported deaths - 4 took place in 2006, and the lowest - 0 in 2003. The data has a decreasing trend.
The average number of fatalities per 1,000 fires is 3. This indicator was the highest - 15 in 2002, and the lowest 0 in 2003. The trend for fatalities per 1,000 fire incidents is decreasing. Compared to the state value the number of deaths per 1,000 incidents is higher.
According to the reports from the years 2002 - 2018 the average number of fire-related fatalities per year is 1. The highest number of reported deaths - 4 took place in 2006, and the lowest - 0 in 2003. The data has a decreasing trend.
The average number of fatalities per 1,000 fires is 3. This indicator was the highest - 15 in 2002, and the lowest 0 in 2003. The trend for fatalities per 1,000 fire incidents is decreasing. Compared to the state value the number of deaths per 1,000 incidents is higher.
 Based on the data from the years 2002 - 2018 the average number of fire-related casualties per year is 13. The highest number of casualties - 25 took place in 2006, and the lowest - 0 in 2004. The data has a dropping trend.
The average number of injuries per 1,000 fire incidents is 23. This indicator was the highest - 43 in 2010, and the lowest 0 in 2004. The trend for injuries per 1,000 fires is dropping. Compared to the state value the number of injuries per 1,000 fires is much higher.
Based on the data from the years 2002 - 2018 the average number of fire-related casualties per year is 13. The highest number of casualties - 25 took place in 2006, and the lowest - 0 in 2004. The data has a dropping trend.
The average number of injuries per 1,000 fire incidents is 23. This indicator was the highest - 43 in 2010, and the lowest 0 in 2004. The trend for injuries per 1,000 fires is dropping. Compared to the state value the number of injuries per 1,000 fires is much higher.Casualties per 1,000 incidents in Marietta, GA compared to nearest cities:
(Note: Based on data for all years, including only cities with at least 500 fire incidents)
| Marietta: | 24.8 |
| Smyrna: | 9.5 |
| Kennesaw: | 11.0 |
| Mableton: | 18.8 |
| Sandy Springs: | 7.1 |
| Powder Springs: | 14.3 |
| Woodstock: | 3.1 |
| Acworth: | 13.6 |
| Austell: | 19.8 |
 29.3% incidents where reported in the morning and 70.7% in the evening. The most fires (15.5%) took place on Monday, and the least (13.3%) on Thursday.
 Based on the 8,588 incident reports from years 2002 - 2018 most fires (10.9%) took place during March, and the least (6.4%) in September.
 Out of all 141,256 cases reported during the years 2002 - 2018, the most belonged to the categories: Rescue & EMS (46.7%), Good Intent Call (20.8%), and Service Call (12.0%).
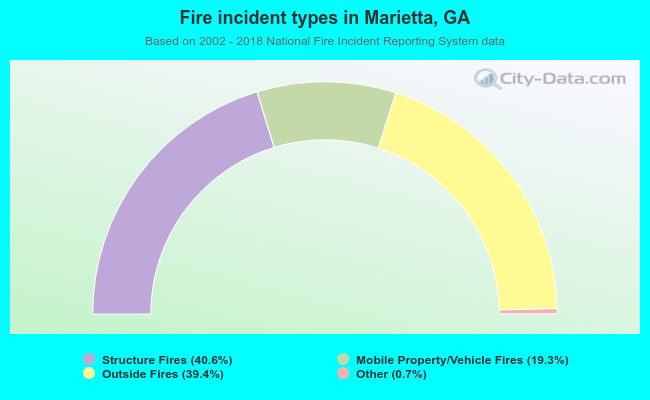 When looking into fire subcategories, the most reports belonged to: Structure Fires (40.6%), and Outside Fires (39.4%).