Mayetta: Fire Incidents, Kansas (KS)
Where are fire incidents reported in Mayetta, KS
Something went wrong! Please refresh the page.
|
| |||||||||||||||||||||||||||||||||||||||||||||||||||||||||||||||||||||||||||||||||||||||||||||||||||||||||||||
2002 - 2018 National Fire Incident Reporting System (NFIRS) incidents
- Incident types reported to NFIRS in Mayetta, KS
- 6,62957.8%Rescue & EMS
- 1,81415.8%Fire
- 1,30511.4%Service Call
- 1,1159.7%Good Intent Call
- 2762.4%Hazardous Condition
- 1671.5%False Alarm
- 1241.1%Severe Weather
- 260.2%Special Incident
- Fire incident types reported to NFIRS in Mayetta, KS
- 1,28971.1%Outside Fires
- 29216.1%Structure Fires
- 1669.2%Mobile Property/Vehicle Fires
- 673.7%Other
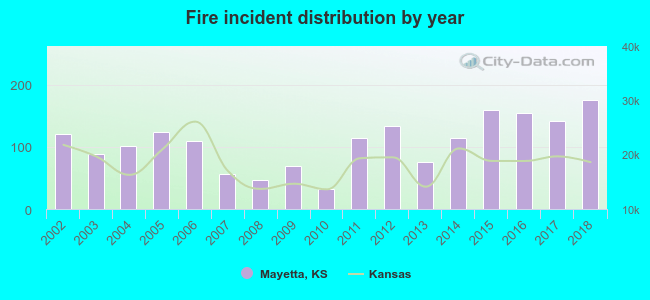 Based on the data from the years 2002 - 2018 the average number of fires per year is 107. The highest number of fire incidents - 175 took place in 2018, and the least - 32 in 2010. The data has an increasing trend.
 The median response time based on all reported fire incidents is 9 minutes. This is higher than the state median value.
The median response time in Mayetta, KS compared to nearest cities:
(Note: Based on data for all years, including only cities with at least 500 fire incidents)
| Mayetta: | 9 minutes |
| Hoyt: | 10 minutes |
| Holton: | 6 minutes |
| Meriden: | 12 minutes |
| Ozawkie: | 15 minutes |
| Silver Lake: | 11 minutes |
| Topeka: | 5 minutes |
| Oskaloosa: | 12 minutes |
| Horton: | 9 minutes |
 22.7% incidents where reported in the morning and 77.3% in the evening. The most fires (16.3%) took place on Sunday, and the least (12.4%) on Tuesday.
 Based on the 1,814 fires from years 2002 - 2018 most fires (28.8%) took place during March, and the least (2.8%) in September.
 Out of all 11,459 cases reported during the years 2002 - 2018, the most belonged to the categories: Rescue & EMS (57.8%), Fire (15.8%), and Service Call (11.4%).
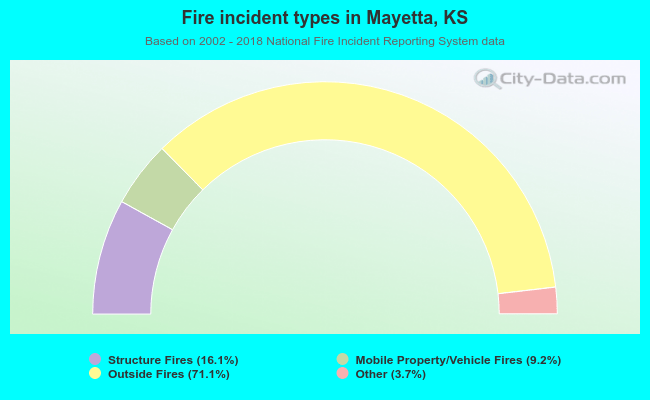 When looking into fire subcategories, the most incidents belonged to: Outside Fires (71.1%), and Structure Fires (16.1%).