Millbrae: Fire Incidents, California (CA)
Where are fire incidents reported in Millbrae, CA
Something went wrong! Please refresh the page.
| Fire incidents reported | |
|---|---|
| Sreet name | Count |
| EL CAMINO REAL | 166 |
| BROADWAY | 116 |
| 280 | 94 |
| MURCHISON DR | 64 |
| 101 | 56 |
| RICHMOND DR | 48 |
| MILLBRAE AV | 46 |
| ROLLINS RD | 36 |
| TAYLOR BLVD | 36 |
| EL CAMINO REAL RT | 34 |
| HILLCREST BLVD | 34 |
| LINCOLN CIR | 34 |
| BROADWAY AVE | 26 |
| HEMLOCK AV | 24 |
| MAGNOLIA AV | 22 |
| MAGNOLIA AVE | 22 |
| MILLBRAE AVE | 22 |
| HELEN DR | 20 |
| VALLEJO DR | 20 |
| CHADBOURNE AV | 18 |
| CLEARFIELD DR | 16 |
| PALM AV | 16 |
| ADRIAN RD | 14 |
| POPLAR AV | 14 |
| VISTA GRANDE | 14 |
| AVIADOR AV | 12 |
| BAY ST | 12 |
| BERTOCCHI LA | 12 |
| CHADBOURNE AVE | 12 |
| HAZEL AV | 12 |
2005 - 2018 National Fire Incident Reporting System (NFIRS) incidents
- Incident types reported to NFIRS in Millbrae, CA
- 6,08952.1%Rescue & EMS
- 1,36111.6%Hazardous Condition
- 1,25010.7%Good Intent Call
- 1,24010.6%Service Call
- 9318.0%Fire
- 7596.5%False Alarm
- 220.2%Overpressure Rupture
- 160.1%Special Incident
- 150.1%Severe Weather
- Fire incident types reported to NFIRS in Millbrae, CA
- 50454.1%Structure Fires
- 28430.5%Outside Fires
- 11412.2%Mobile Property/Vehicle Fires
- 293.1%Other
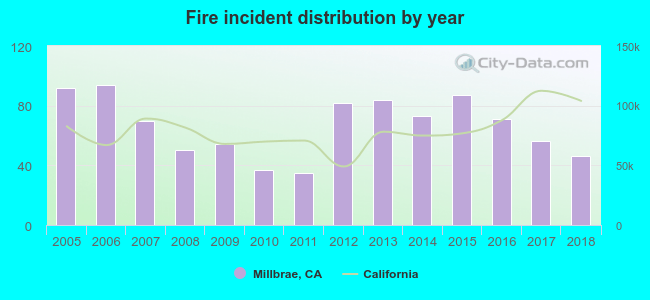 According to the data from the years 2005 - 2018 the average number of fire incidents per year is 67. The highest number of reported fires - 94 took place in 2006, and the least - 35 in 2011. The data has a dropping trend.
The average number of yearly fire incidents per 10k residents in Millbrae, CA compared to nearest cities:
(Note: Based on data for the last 3 years, including only cities with population 5,000 and above)
| Millbrae: | 25.4 |
| San Bruno: | 22.9 |
| Burlingame: | 17.3 |
| Hillsborough: | 12.6 |
| South San Francisco: | 19.8 |
| Pacifica: | 20.9 |
| San Mateo: | 14.1 |
| Daly City: | 14.1 |
| El Granada: | 4.9 |
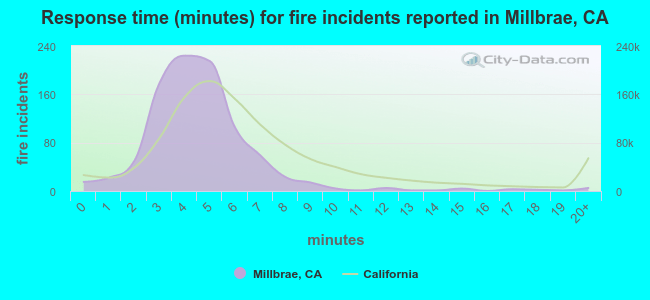 The median response time based on all reported fire incidents is 4 minutes. This is lower than the state median value.
The median response time in Millbrae, CA compared to nearest cities:
(Note: Based on data for all years, including only cities with at least 500 fire incidents)
| Millbrae: | 4 minutes |
| San Bruno: | 4 minutes |
| Burlingame: | 4 minutes |
| South San Francisco: | 4 minutes |
| Pacifica: | 5 minutes |
| San Mateo: | 4 minutes |
| Brisbane: | 5 minutes |
| Daly City: | 4 minutes |
| Foster City: | 4 minutes |
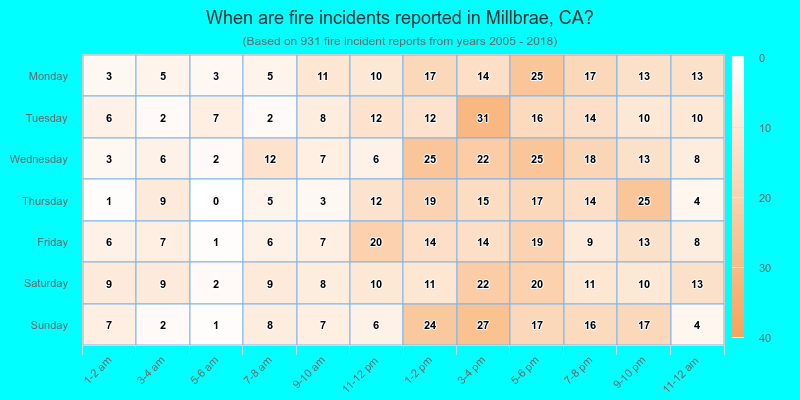
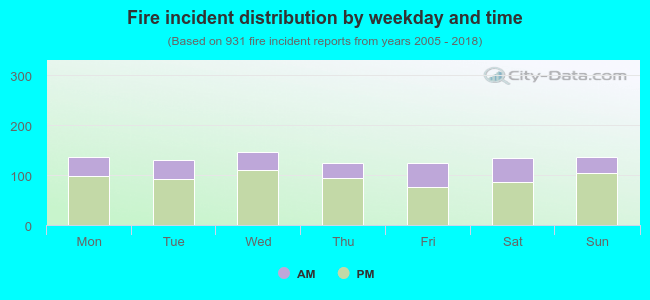 28.5% incidents where reported in the morning and 71.5% in the evening. The most fires (15.8%) took place on Wednesday, and the least (13.3%) on Thursday.
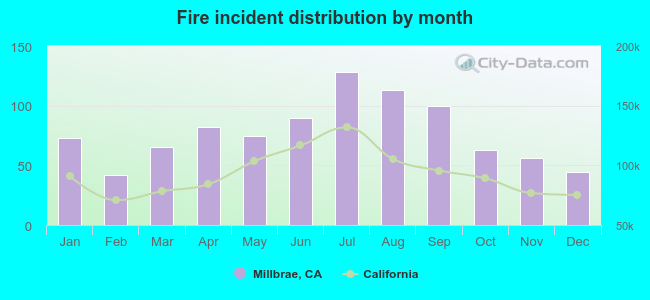 Based on the 931 fire incidents from years 2005 - 2018 most fires (13.7%) took place during July, and the least (4.5%) in February.
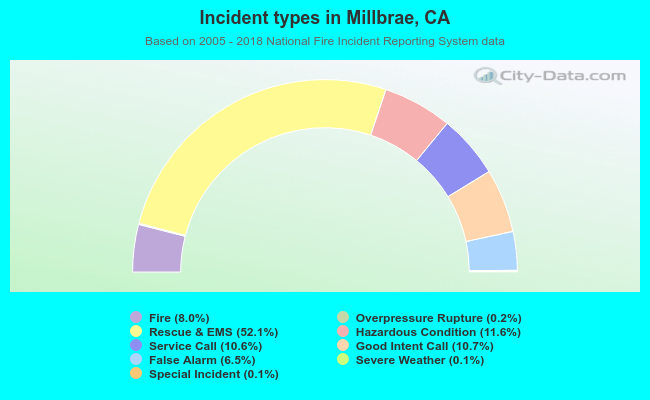 Out of all 11,683 cases reported during the years 2005 - 2018, the most belonged to the categories: Rescue & EMS (52.1%), Hazardous Condition (11.6%), and Good Intent Call (10.7%).
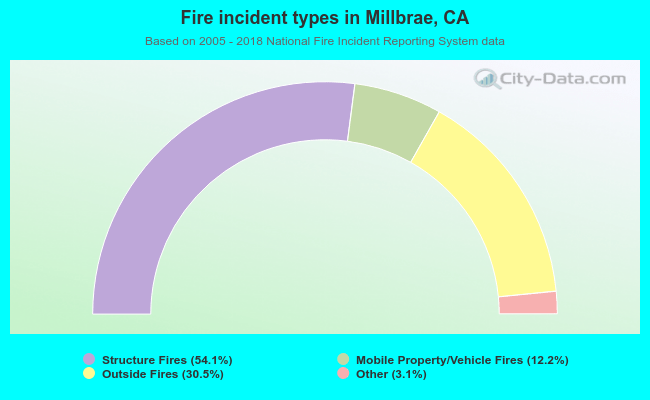 When looking into fire subcategories, the most incidents belonged to: Structure Fires (54.1%), and Outside Fires (30.5%).