| Fire incidents reported |
|---|
| Sreet name | Count |
|---|
| ST RTE 61 N | 14 | | HETTLE RD | 12 | | PERU CENTER RD | 12 | | PERU CENTER RD. RD | 12 | | RIDGE ST | 12 | | MONROE ST | 10 | | PERU CENTER N RD | 10 | | ST RTE 99 N | 10 | | PONTIAC SECTION LINE RD | 8 | | REMELLE RD | 8 | | SANDUSKY ST | 8 | | GEIGER RD. RD | 6 | | ST RT 99 HWY | 6 | | STRECKER ROAD | 6 | | DOGTOWN RD | 4 | | FERN RD | 4 | | GEIGER RD | 4 | | HALFWAY RD | 4 | | HETTLE RD. RD | 4 | | MEAD RD. RD | 4 | | MONROE ST. ST | 4 | | PERU HOLLOW RD | 4 | | PERU WEST SECTION LINE RD RD | 4 | | SNYDER RD | 4 | | ST RTE 61 S | 4 |
| | | Fire incidents reported |
|---|
| Sreet name | Count |
|---|
| ST RTE 99 SOUTH | 4 | | ST. RTE.99 HWY | 4 | | SURREY CT | 4 | | U.S. RTE.20 HWY | 4 | | US RTE 20 W | 4 | | BAKER | 2 | | BAKER ROAD | 2 | | BROAD ST | 2 | | BROWN ST | 2 | | BROWN STMONROE ST | 2 | | CAMPBELL ST | 2 | | CLOCK LN | 2 | | COUNTY RD. 191 RD | 2 | | DELAMATRE RD | 2 | | DELAMATRE RD. RD | 2 | | DELEMATRE | 2 | | DOGTOWN RD. RD | 2 | | EVERINGIN RD | 2 | | FARR DR | 2 | | FARR RD. RD | 2 | | FERN RD. RD | 2 | | FORT MONROE ST. ST | 2 | | FULTON ST | 2 | | GRAHAM RD | 2 | | |
|
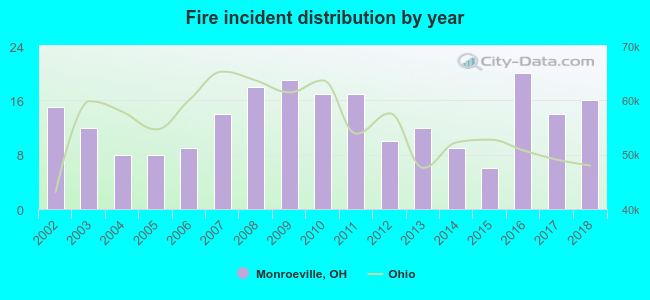 According to the data from the years 2002 - 2018 the average number of fire incidents per year is 13. The highest number of fires - 20 took place in 2016, and the least - 6 in 2015. The data has an increasing trend.
 34.4% incidents where reported in the morning and 65.6% in the evening. The most fires (16.1%) took place on Tuesday, and the least (12.9%) on Sunday.
 According to the 224 fire incidents from years 2002 - 2018 most fires (11.2%) took place during July, and the least (5.4%) in February.
 Out of all 858 cases reported during the years 2002 - 2018, the most belonged to the categories: Overpressure Rupture (43.1%), Fire (26.1%), and Rescue & EMS (18.4%).
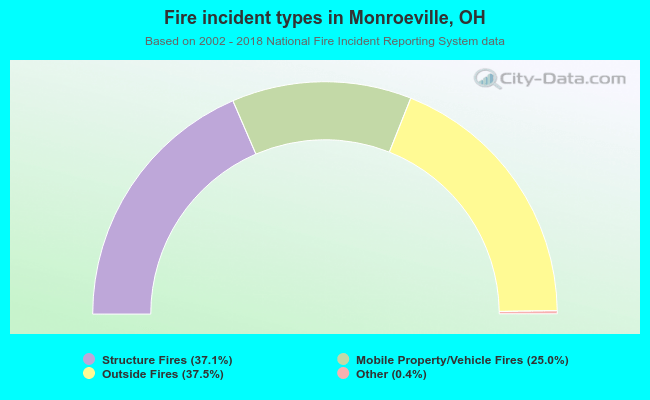 When looking into fire subcategories, the most reports belonged to: Outside Fires (37.5%), and Structure Fires (37.1%).