Monticello: Fire Incidents, Mississippi (MS)
Where are fire incidents reported in Monticello, MS
Something went wrong! Please refresh the page.
|
| |||||||||||||||||||||||||||||||||||||||||||||||||||||||||||||||||||||||||||||||||||||||||||||||||||||||||||||
| Other | 160 | |||||||||||||||||||||||||||||||||||||||||||||||||||||||||||||||||||||||||||||||||||||||||||||||||||||||||||||
2003 - 2018 National Fire Incident Reporting System (NFIRS) incidents
- Incident types reported to NFIRS in Monticello, MS
- 92045.2%Fire
- 76037.4%Rescue & EMS
- 1366.7%Good Intent Call
- 803.9%Hazardous Condition
- 592.9%False Alarm
- 462.3%Severe Weather
- 301.5%Service Call
- 30.1%Overpressure Rupture
- Fire incident types reported to NFIRS in Monticello, MS
- 45349.2%Outside Fires
- 33035.9%Structure Fires
- 12313.4%Mobile Property/Vehicle Fires
- 141.5%Other
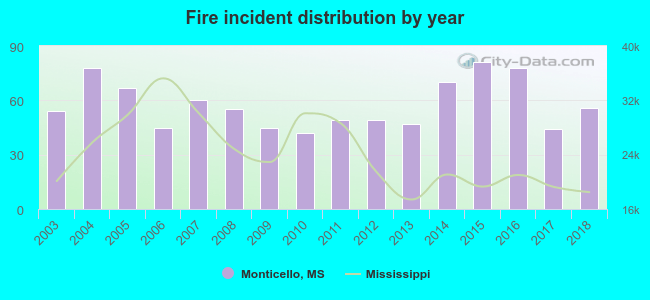 According to the data from the years 2003 - 2018 the average number of fire incidents per year is 58. The highest number of fire incidents - 81 took place in 2015, and the least - 42 in 2010. The data has a rising trend.
 The median response time based on all reported fire incidents is 6 minutes. This is similar to the state median value.
The median response time in Monticello, MS compared to nearest cities:
(Note: Based on data for all years, including only cities with at least 500 fire incidents)
| Monticello: | 6 minutes |
| Silver Creek: | 9 minutes |
| Prentiss: | 10 minutes |
| Wesson: | 10 minutes |
| Brookhaven: | 7 minutes |
| Bassfield: | 5 minutes |
| Foxworth: | 10 minutes |
| Columbia: | 9 minutes |
| Hazlehurst: | 10 minutes |
 According to the reports from the years 2003 - 2018 the average number of fire-related fatalities per year is 0. The highest number of reported deaths - 2 took place in 2009, and the lowest - 0 in 2003. The data has a constant trend.
 28.6% incidents where reported in the morning and 71.4% in the evening. The most fires (17.9%) took place on Saturday, and the least (12.3%) on Friday.
 According to the 920 incident reports from years 2003 - 2018 most fires (12.8%) took place during March, and the least (5.3%) in July.
 Out of all 2,034 cases reported during the years 2003 - 2018, the most belonged to the categories: Fire (45.2%), Rescue & EMS (37.4%), and Good Intent Call (6.7%).
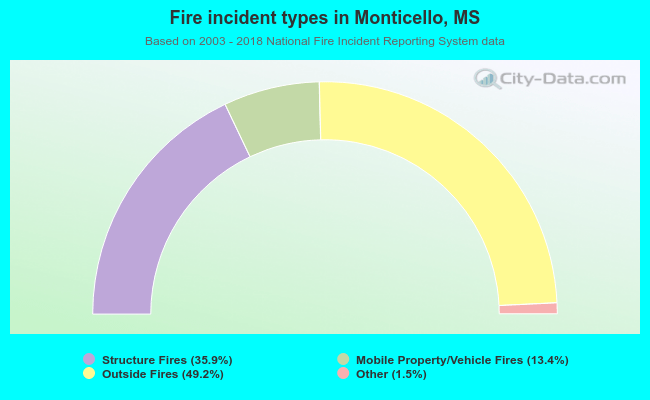 When looking into fire subcategories, the most incidents belonged to: Outside Fires (49.2%), and Structure Fires (35.9%).