Mosinee: Fire Incidents, Wisconsin (WI)
Where are fire incidents reported in Mosinee, WI
Something went wrong! Please refresh the page.
|
| |||||||||||||||||||||||||||||||||||||||||||||||||||||||||||||||||||||||||||||||||||||||||||||||||||||||||||||
| Other | 87 | |||||||||||||||||||||||||||||||||||||||||||||||||||||||||||||||||||||||||||||||||||||||||||||||||||||||||||||
2004 - 2018 National Fire Incident Reporting System (NFIRS) incidents
- Incident types reported to NFIRS in Mosinee, WI
- 39346.3%Fire
- 18021.2%Rescue & EMS
- 11613.7%Good Intent Call
- 10612.5%Hazardous Condition
- 333.9%False Alarm
- 151.8%Service Call
- 40.5%Severe Weather
- 10.1%Special Incident
- Fire incident types reported to NFIRS in Mosinee, WI
- 25163.9%Structure Fires
- 7719.6%Outside Fires
- 379.4%Mobile Property/Vehicle Fires
- 287.1%Other
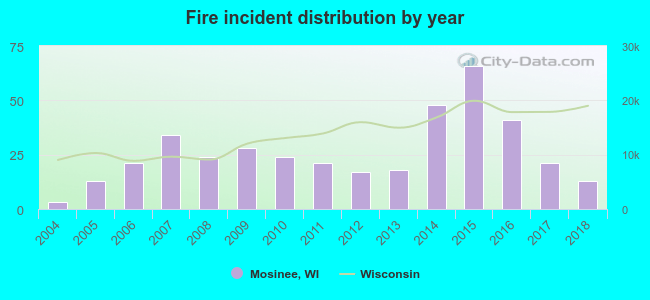 According to the data from the years 2004 - 2018 the average number of fire incidents per year is 26. The highest number of fire incidents - 66 took place in 2015, and the least - 3 in 2004. The data has a growing trend.
 37.4% incidents where reported in the morning and 62.6% in the evening. The most fires (18.3%) took place on Sunday, and the least (9.9%) on Tuesday.
 According to the 393 fires from years 2004 - 2018 most fires (12.2%) took place during January, and the least (3.3%) in September.
 Out of all 848 cases reported during the years 2004 - 2018, the most belonged to the categories: Fire (46.3%), Overpressure Rupture (21.2%), and Service Call (13.7%).
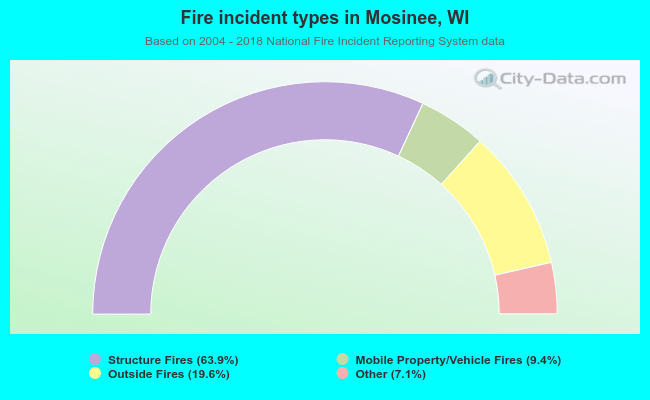 When looking into fire subcategories, the most reports belonged to: Structure Fires (63.9%), and Outside Fires (19.6%).