New Boston: Fire Incidents, Texas (TX)
Where are fire incidents reported in New Boston, TX
Something went wrong! Please refresh the page.
|
| |||||||||||||||||||||||||||||||||||||||||||||||||||||||||||||||||||||||||||||||||||||||||||||||||||||||||||||
| Other | 35 | |||||||||||||||||||||||||||||||||||||||||||||||||||||||||||||||||||||||||||||||||||||||||||||||||||||||||||||
2002 - 2017 National Fire Incident Reporting System (NFIRS) incidents
- Incident types reported to NFIRS in New Boston, TX
- 80968.4%Fire
- 13211.2%Hazardous Condition
- 927.8%Rescue & EMS
- 776.5%Good Intent Call
- 363.0%Service Call
- 242.0%False Alarm
- 80.7%Severe Weather
- 30.3%Overpressure Rupture
- 20.2%Special Incident
- Fire incident types reported to NFIRS in New Boston, TX
- 46056.9%Outside Fires
- 21426.5%Structure Fires
- 12515.5%Mobile Property/Vehicle Fires
- 101.2%Other
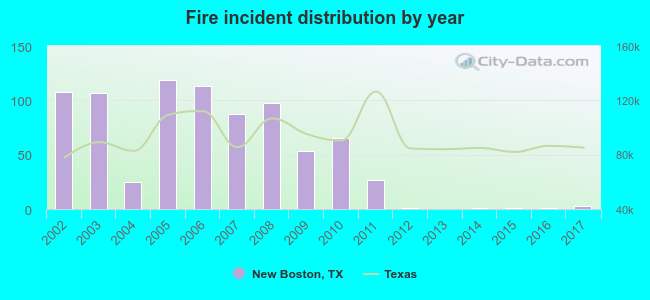 Based on the data from the years 2002 - 2017 the average number of fires per year is 51. The highest number of fires - 119 took place in 2005, and the least - 0 in 2013. The data has a dropping trend.
 The median response time based on all reported fire incidents is 7 minutes. This is comparable to the state median value.
The median response time in New Boston, TX compared to nearest cities:
(Note: Based on data for all years, including only cities with at least 500 fire incidents)
| New Boston: | 7 minutes |
| Maud: | 10 minutes |
| De Kalb: | 10 minutes |
| Texarkana: | 5 minutes |
| Ashdown: | 7 minutes |
| Texarkana: | 5 minutes |
| Queen City: | 11 minutes |
| Atlanta: | 7 minutes |
| Fouke: | 10 minutes |
 24.2% incidents where reported in the morning and 75.8% in the evening. The most fires (17.6%) took place on Saturday, and the least (11.5%) on Friday.
 Based on the 809 fire incident reports from years 2002 - 2017 most fires (12.7%) took place during January, and the least (4.9%) in July.
 Out of all 1,183 cases reported during the years 2002 - 2017, the most belonged to the categories: Fire (68.4%), Hazardous Condition (11.2%), and Rescue & EMS (7.8%).
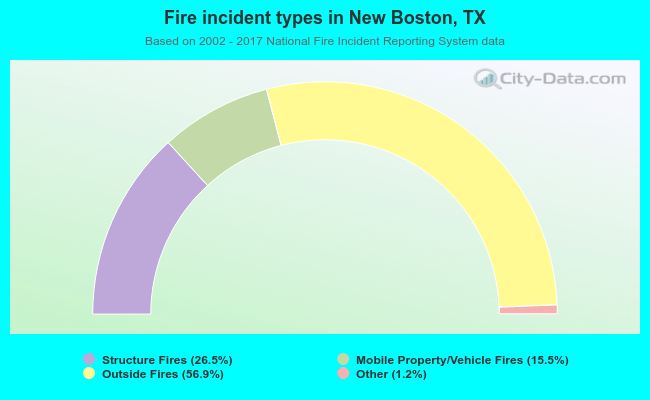 When looking into fire subcategories, the most incidents belonged to: Outside Fires (56.9%), and Structure Fires (26.5%).