Newton: Fire Incidents, Massachusetts (MA)
Where are fire incidents reported in Newton, MA
Something went wrong! Please refresh the page.
| Fire incidents reported | |
|---|---|
| Sreet name | Count |
| WASHINGTON ST ST | 250 |
| BOYLSTON ST ST | 180 |
| CENTRE ST ST | 144 |
| WALNUT ST ST | 136 |
| BEACON ST ST | 120 |
| WASHINGTON ST | 114 |
| NEEDHAM ST ST | 98 |
| COMMONWEALTH AVE ST | 82 |
| COMMONWEALTH AVE | 68 |
| WATERTOWN ST ST | 64 |
| DEDHAM ST ST | 56 |
| CALIFORNIA ST ST | 48 |
| CHESTNUT ST ST | 48 |
| GROVE ST ST | 42 |
| LANGLEY RD ST | 42 |
| GROVE ST | 40 |
| ADAMS ST ST | 38 |
| UNION ST ST | 36 |
| CRAFTS ST ST | 34 |
| HAMMOND POND PKWY ST | 34 |
| WALTHAM ST ST | 34 |
| BOYLSTON ST | 32 |
| ELLIOT ST ST | 32 |
| WOODLAND RD ST | 30 |
| BEACON ST | 28 |
| LOWELL AVE ST | 28 |
| AUBURN ST ST | 26 |
| CENTRE ST | 26 |
| COMMONWEALTH AVE AVE | 26 |
| FULLER ST ST | 26 |
| Other | 1,131 |
2002 - 2018 National Fire Incident Reporting System (NFIRS) incidents
- Incident types reported to NFIRS in Newton, MA
- 20,20640.2%Rescue & EMS
- 9,91219.7%False Alarm
- 9,25218.4%Hazardous Condition
- 5,47910.9%Service Call
- 3,0936.2%Fire
- 2,2324.4%Good Intent Call
- 580.1%Special Incident
- Fire incident types reported to NFIRS in Newton, MA
- 1,86360.2%Structure Fires
- 87028.1%Outside Fires
- 2789.0%Mobile Property/Vehicle Fires
- 822.7%Other
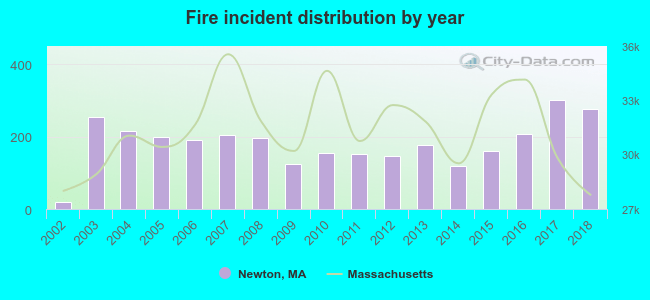 Based on the data from the years 2002 - 2018 the average number of fire incidents per year is 182. The highest number of reported fires - 300 took place in 2017, and the least - 18 in 2002. The data has a growing trend.
The average number of yearly fire incidents per 10k residents in Newton, MA compared to nearest cities:
(Note: Based on data for the last 3 years, including only cities with population 5,000 and above)
| Newton: | 29.6 |
| Watertown: | 12.2 |
| Waltham: | 31.2 |
| Needham: | 17.8 |
| Brookline: | 72.0 |
| Belmont: | 42.3 |
| Weston: | 34.3 |
| Wellesley: | 18.2 |
| Cambridge: | 99.2 |
 The median response time based on all reported fire incidents is 5 minutes. This is higher than the state median value.
The median response time in Newton, MA compared to nearest cities:
(Note: Based on data for all years, including only cities with at least 500 fire incidents)
| Newton: | 5 minutes |
| Watertown: | 4 minutes |
| Waltham: | 4 minutes |
| Needham: | 4 minutes |
| Brookline: | 3 minutes |
| Belmont: | 4 minutes |
| Weston: | 4 minutes |
| Wellesley: | 4 minutes |
| Cambridge: | 5 minutes |
 Based on the data from the years 2002 - 2018 the average number of fire-related fatalities per year is 0. The highest number of deaths - 2 took place in 2011, and the lowest - 0 in 2002. The data has a constant trend.
The average number of deaths per 1,000 fire incidents is 2. This indicator was the highest - 13 in 2011, and the lowest 0 in 2002. The trend for deaths per 1,000 fires is constant. Compared to the Massachusetts value the number of fatalities per 1,000 incidents is about the same.
Based on the data from the years 2002 - 2018 the average number of fire-related fatalities per year is 0. The highest number of deaths - 2 took place in 2011, and the lowest - 0 in 2002. The data has a constant trend.
The average number of deaths per 1,000 fire incidents is 2. This indicator was the highest - 13 in 2011, and the lowest 0 in 2002. The trend for deaths per 1,000 fires is constant. Compared to the Massachusetts value the number of fatalities per 1,000 incidents is about the same.
 Based on the reports from the years 2002 - 2018 the average number of fire-related yearly casualties is 2. The highest number of casualties - 4 took place in 2003, and the lowest - 0 in 2002. The data has a constant trend.
The average number of casualties per 1,000 fire incidents is 8. This indicator was the highest - 24 in 2009, and the lowest 0 in 2002. The trend for casualties per 1,000 fires is constant. Compared to the state value the number of casualties per 1,000 fires is lower.
Based on the reports from the years 2002 - 2018 the average number of fire-related yearly casualties is 2. The highest number of casualties - 4 took place in 2003, and the lowest - 0 in 2002. The data has a constant trend.
The average number of casualties per 1,000 fire incidents is 8. This indicator was the highest - 24 in 2009, and the lowest 0 in 2002. The trend for casualties per 1,000 fires is constant. Compared to the state value the number of casualties per 1,000 fires is lower.
 31.4% incidents where reported in the morning and 68.6% in the evening. The most fires (16.3%) took place on Monday, and the least (13.1%) on Wednesday.
 Based on the 3,093 reports from years 2002 - 2018 most fires (10.3%) took place during May, and the least (7.0%) in November.
 Out of all 50,289 cases reported during the years 2002 - 2018, the most belonged to the categories: Rescue & EMS (40.2%), False Alarm (19.7%), and Hazardous Condition (18.4%).
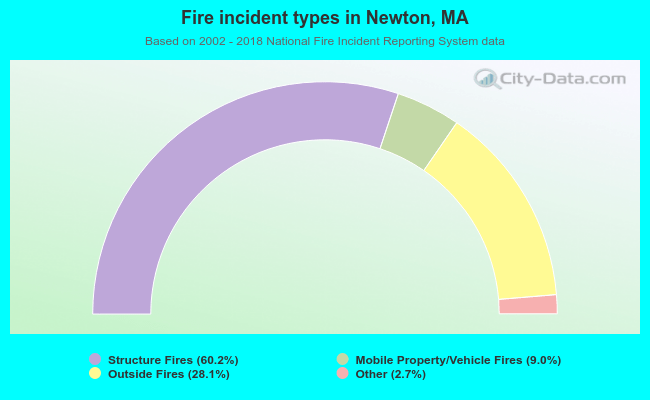 When looking into fire subcategories, the most reports belonged to: Structure Fires (60.2%), and Outside Fires (28.1%).